Monitoring System Access and Performance
444
ProSecure Unified Threat Management (UTM) Appliance
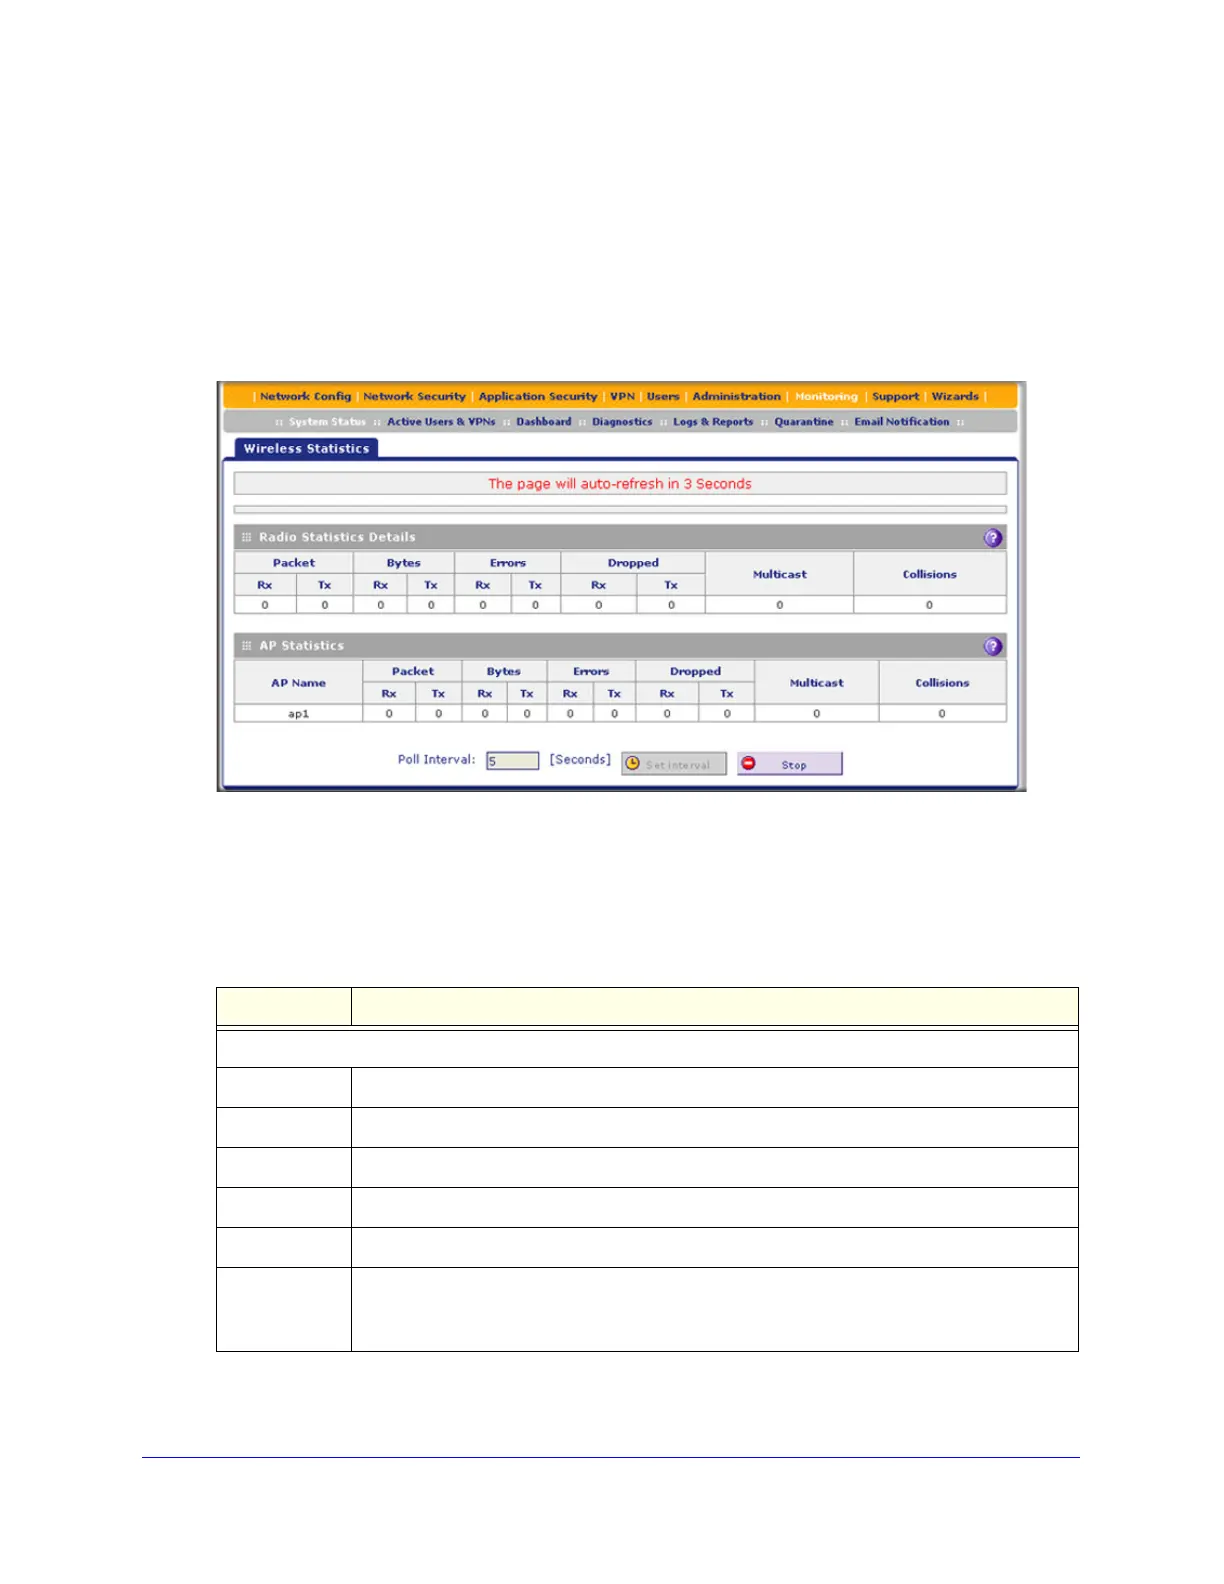
View the Wireless Statistics Screen (UTM9S Only)
To view the Wireless Statistics screen:
1. Select Monitoring > System Status > Network Status. The Network Status screen
displays.
2. Click the Wireless Statistics option arrow in the upper right of the Network Status screen.
The Wireless Statistics screen displays:
Figure 263.
The following table explains the fields of the Wireless Statistics screen.
To change the poll interval period, enter a new value in the Poll Interval field, and then
click Set interval. To stop polling, click Stop.
Table 115. Wireless Statistics screen fields
Item Description
Radio Statistics Details
Packets The number of received (Rx) and transmitted (Tx) packets on the radio in bytes.
Bytes The number of received (Rx) and transmitted (Tx) bytes on the radio.
Errors The number of received (Rx) and transmitted (Tx) errors on the radio.
Dropped The number of received (Rx) and transmitted (Tx) dropped packets on the radio.
Multicast The number of received (Rx) and transmitted (Tx) multicast packets on the radio.
Collisions The number of signal collisions that have occurred on the radio. A collision occurs when
the radio attempts to send data at the same time as a wireless station that is connected to
the radio.
 Loading...