Monitoring System Access and Performance
477
ProSecure Unified Threat Management (UTM) Appliance
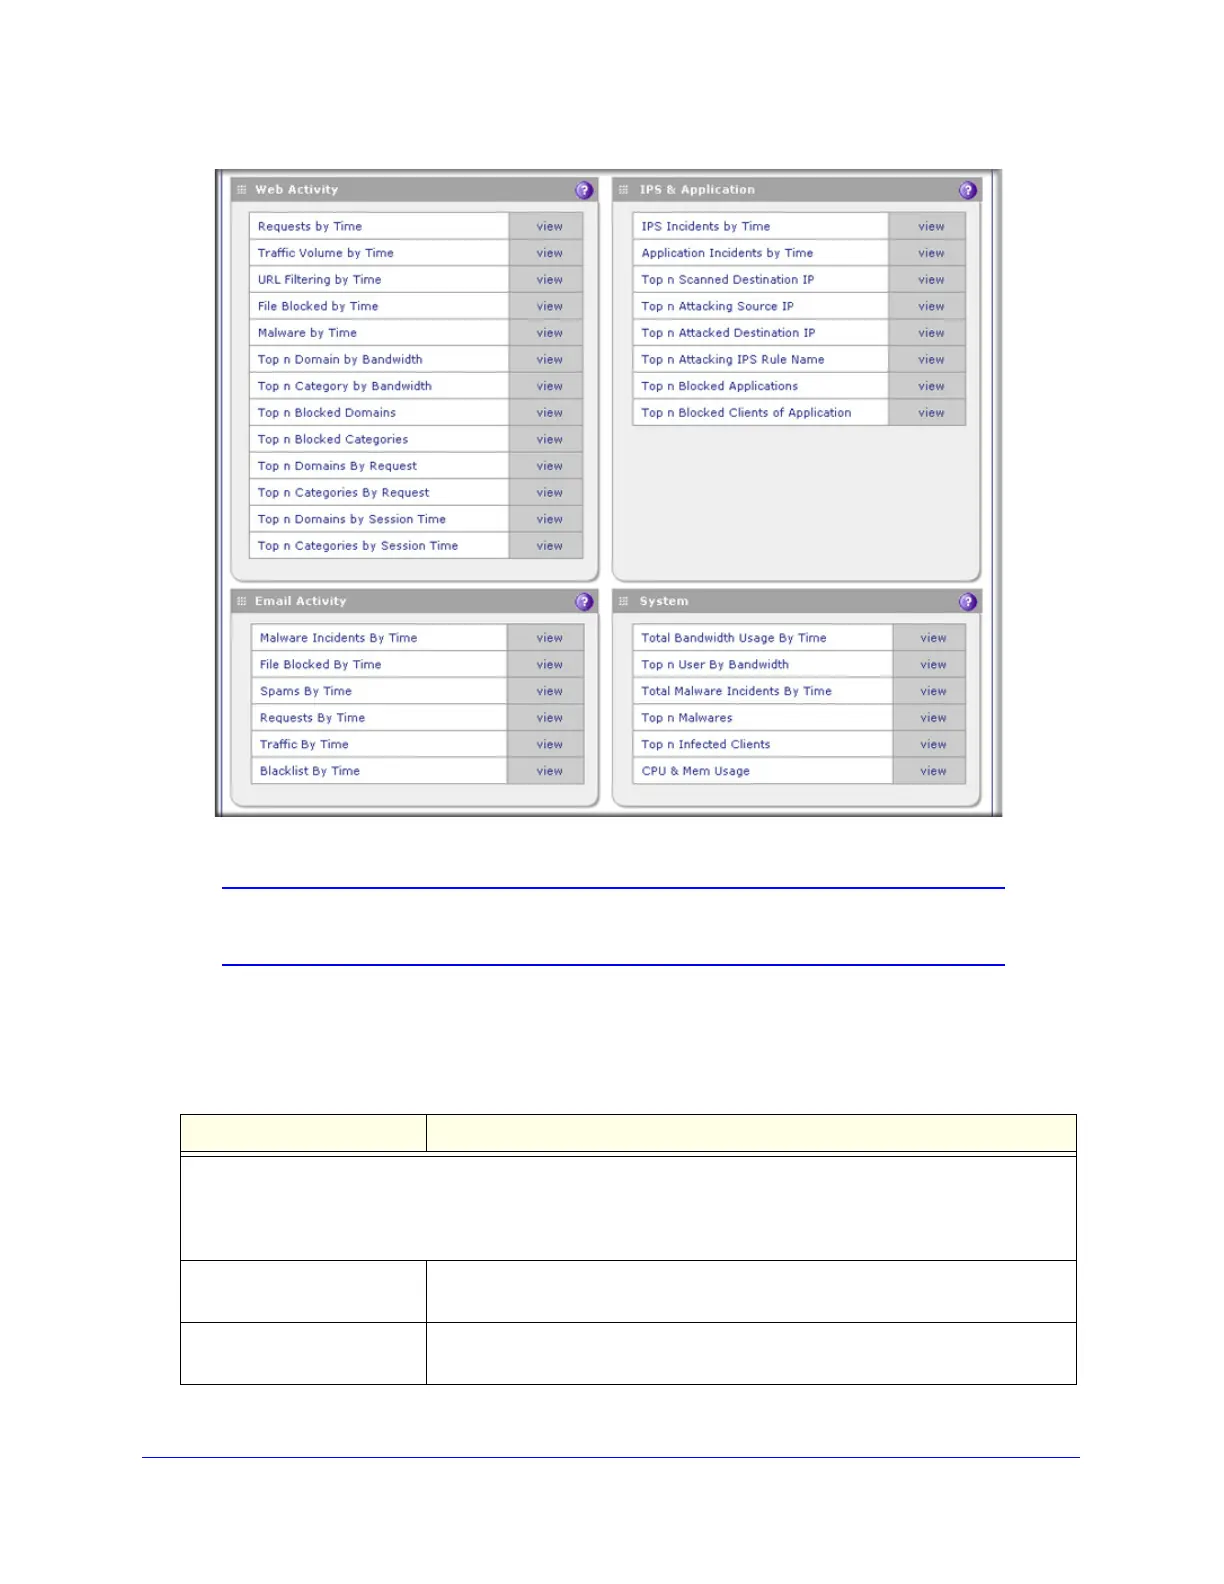
Figure 285. Report, screen 2 of 4
Note: For information about setting a time range and other filtering options
for a report, see the previous section.
2. Select a report by clicking View next to the report to display the selected report onscreen.
The following table explains the contents of the reports.
Table 126. Report screen: report template information
Report template Information reported for the specified time range
Web Activity
Note: To generate web reports, make sure that the Log HTTP Traffic check box on the Content Filtering screen
is selected (see Configure Web Content Filtering on page 199).
Requests by Time For each of the three web server protocols separately, a chart and a table with
the number of web requests.
Traffic Volume by Time For each of the three web server protocols separately, a chart and a table with
the processed traffic, expressed in bytes.
 Loading...