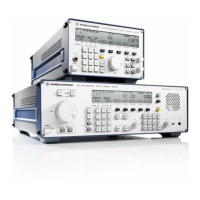
V L F > H F R E C E I V E R S
f
R & S E K 8 9 5 / R & S E K 8 9 6
User Manual
f
Separate Functions 1
3.1.20 Separate Functions 1
By actuating the key ENT the separate func>
tions menu 1 is called up. The menu offers the
following functions:
f IND (fast switchover of bargraph func>
tion (level / tuning indication))
f NTCH (switch notch filter on or off)
f NB (switch noise blanker on or off)
f SQ (switch squelch function on or off)
f PAMP (switch preamplifier on or off)
The currently effective status for the functions
NTCH, NB, SQ and PAMP is displayed in the
status line. Activation of a function is indicated
by a black bar.
In the function level indication the bargraph
indicates the following, depending on the set
type of control (see control type field):
f In the type of control AGC and A+D, the
bargraph indicates the current receive
level.
f In the type of control MGC, the bargraph
indicates the control voltage set via the HF
control.
f In the type of control A+M, the bargraph
indicates either the control voltage set via
the HF control (receive level < set control
voltage) or the current receive level
(receive level > set control voltage).
f In the function CHM (see 3.1.16) the bar>
graph indicates the digital threshold stored
in the channel.
Display range: . . . . . . . . 0 to 120 dBoV
Resolution: . . . . . . . . . . 5 dB
In the function tuning indication the bargraph
indicates the following, depending on the set
modulation mode (see modulation mode
field):
f For the modulation modes FSK, AFSK and
F7B the bargraph indicates the actual fre>
quency deviation as well as a frequency
offset, if set.
For a frequency deviation of 42 Hz or 85 Hz
holds the following:
Display range: ............... >120 to +120 Hz
Resolution: .................... 10 Hz
For a frequency deviation of 225 Hz or 425 Hz
holds the following:
Display range: ............... >1200 to +1200 Hz
Resolution: .................... 100 Hz
The set frequency deviation is indicated in the
frequency deviation menu (see 3.1.8.4.1).
f For the modulation modes AM, CW, FAX1,
FAX2 and FM the bargraph indicates a fre>
quency offset, if set.
For a bandwidth of 200 Hz holds the following:
Display range: ............... >120 to +120 Hz
Resolution: .................... 10 Hz
For bandwidths larger than 200 Hz holds the
following:
Display range: ............... >1200 to +1200 Hz
Resolution: .................... 100 Hz
The set bandwidth is indicated in the band>
width field.
3.1.20.1 Fast Switchover of Bargraph
Function (Level / Tuning Indica>
tion)
Note:
In the modulation modes ISB, USB and LSB the
function tuning indication is not effective.
Except for entries, e.g. of a frequency , the bar>
graph function is switched over from level in>
dication to tuning indication and vice versa by
actuating key ENT and softkey IND.
The switchover of the bargraph function has
no effect on the bargraph mode (see
3.1.18.15).
6164.0717.02_01
> 3.58 >

 Loading...