9.12
SEL-749M Relay Instruction Manual Date Code 20080918
Analyzing Events
Event Reporting
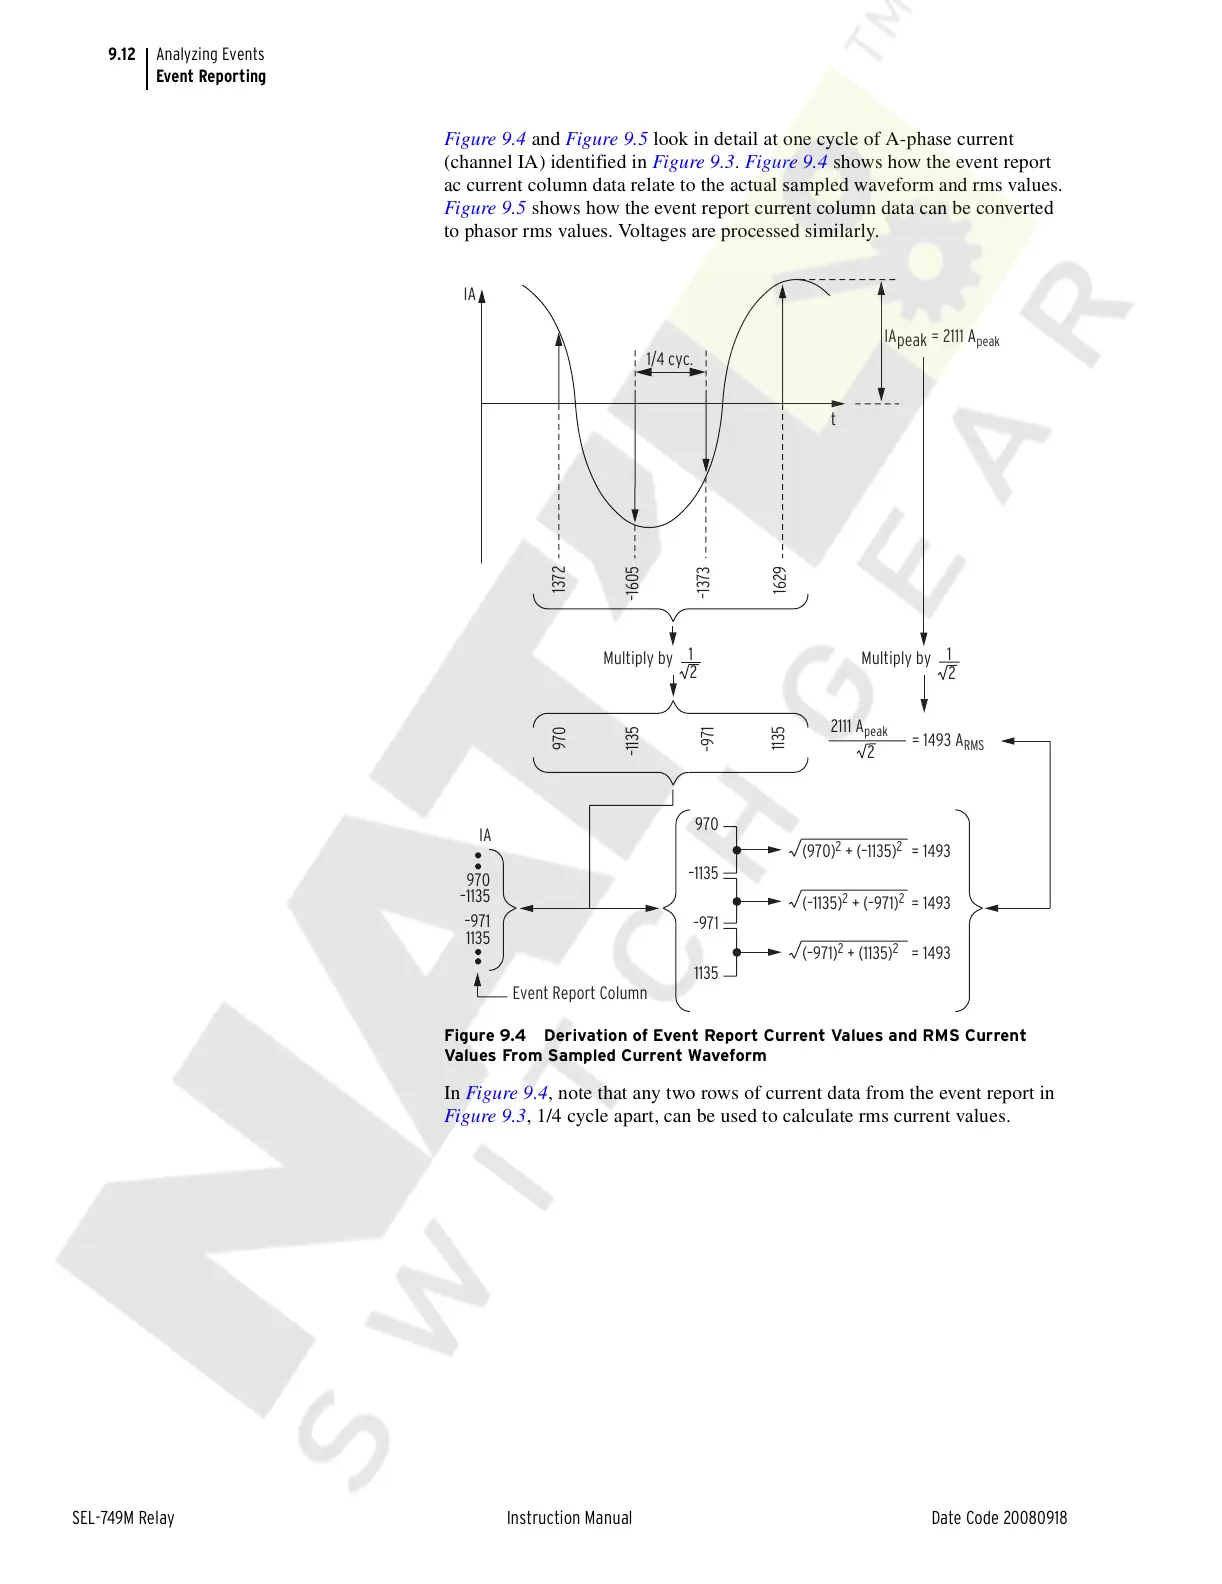
Figure 9.4 and Figure 9.5 look in detail at one cycle of A-phase current
(channel IA) identified in Figure 9.3. Figure 9.4 shows how the event report
ac current column data relate to the actual sampled waveform and rms values.
Figure 9.5 shows how the event report current column data can be converted
to phasor rms values. Voltages are processed similarly.
Figure 9.4 Derivation of Event Report Current Values and RMS Current
Values From Sampled Current Waveform
In Figure 9.4, note that any two rows of current data from the event report in
Figure 9.3, 1/4 cycle apart, can be used to calculate rms current values.
Event Report Column
970
–1135
–971
1135
1135
–971
–1135
970
IA
1
2
2
2
Multiply by
1
Multiply by
1135
–1135
–971
970
–1373
–1605
1372
1629
t
IA
1/4 cyc.
IA
peak
= 2111 A
peak
2111 A
peak
= 1493 A
RMS
(970)
2
+ (–1135)
2
(–1135)
2
+ (–971)
2
(–971)
2
+ (1135)
2
= 1493
= 1493
= 1493
Courtesy of NationalSwitchgear.com