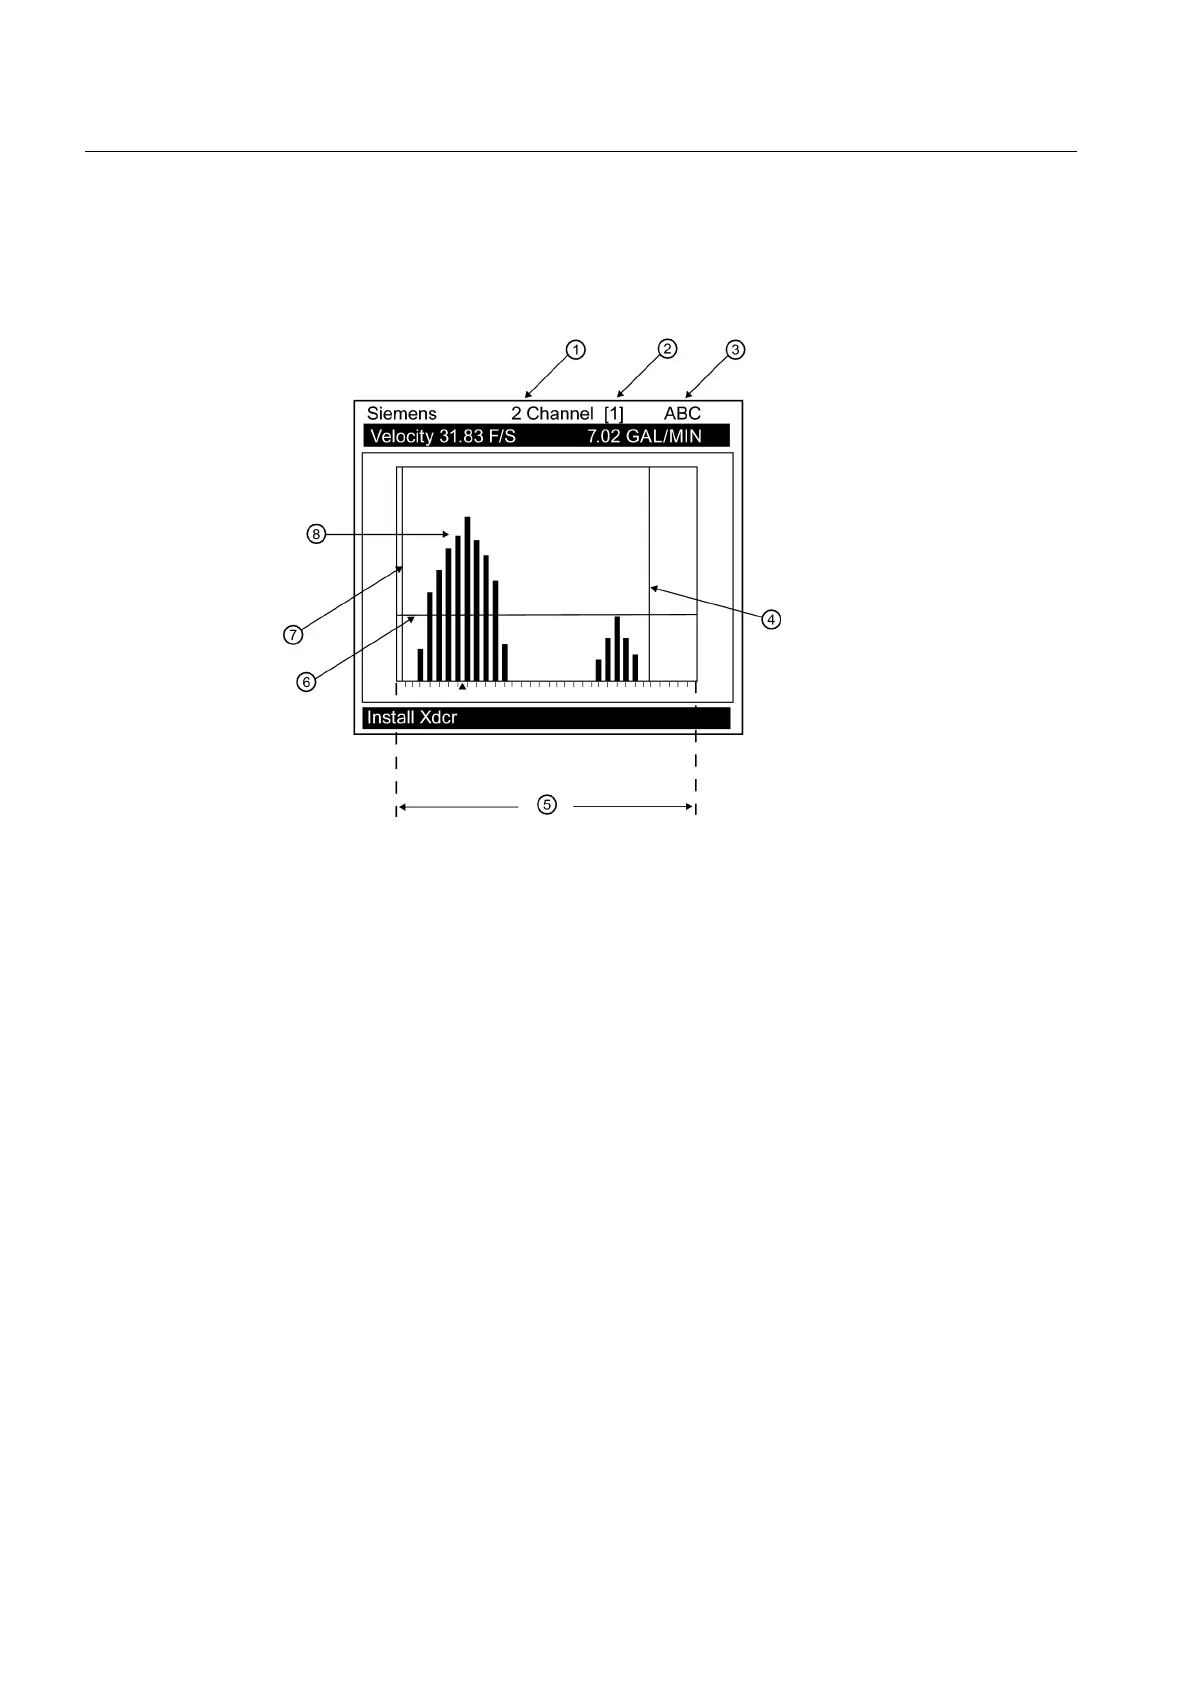
● The horizontal scale represents flow velocity with the higher velocities on the right and lower
velocities on the left.
● The
vertical axis is relative amplitude or magnitude; each bar shows the relative amplitude
for a velocity range.
① Meter Type ⑤ Flow Velocity Range
② Measurement Channel ⑥ Noise Level Set Cursor
③ Site Name ⑦ Low Limit Cursor
④ High Limit Cursor ⑧ Signal Amplitude
Figure 7-4 Spectra Graph Display Screen
The reported flow rate is the mean value of the included Spectra Graph bars. It is computed
by excluding signals that are lower (to the left of) than the Low Limit Cursor or higher (to the
right of) than the High Flow Cursor or lower (under) than the Noise Cursor.
Functions
7.11 Reflexor
FUP1010 IP67 Portable Flowmeter
104
Operating Instructions, 02/2010, A5E02951522A Revision 01
 Loading...