Instructions for Use 9 Analyzing Exam Data and Creating Reports
2660021169042 Rev. A 2018-03 9.5 Using Presets
2660021169042 Rev. A 2018-03 147 / 246
Pos Name Inner Boundary Outer Boundary Example
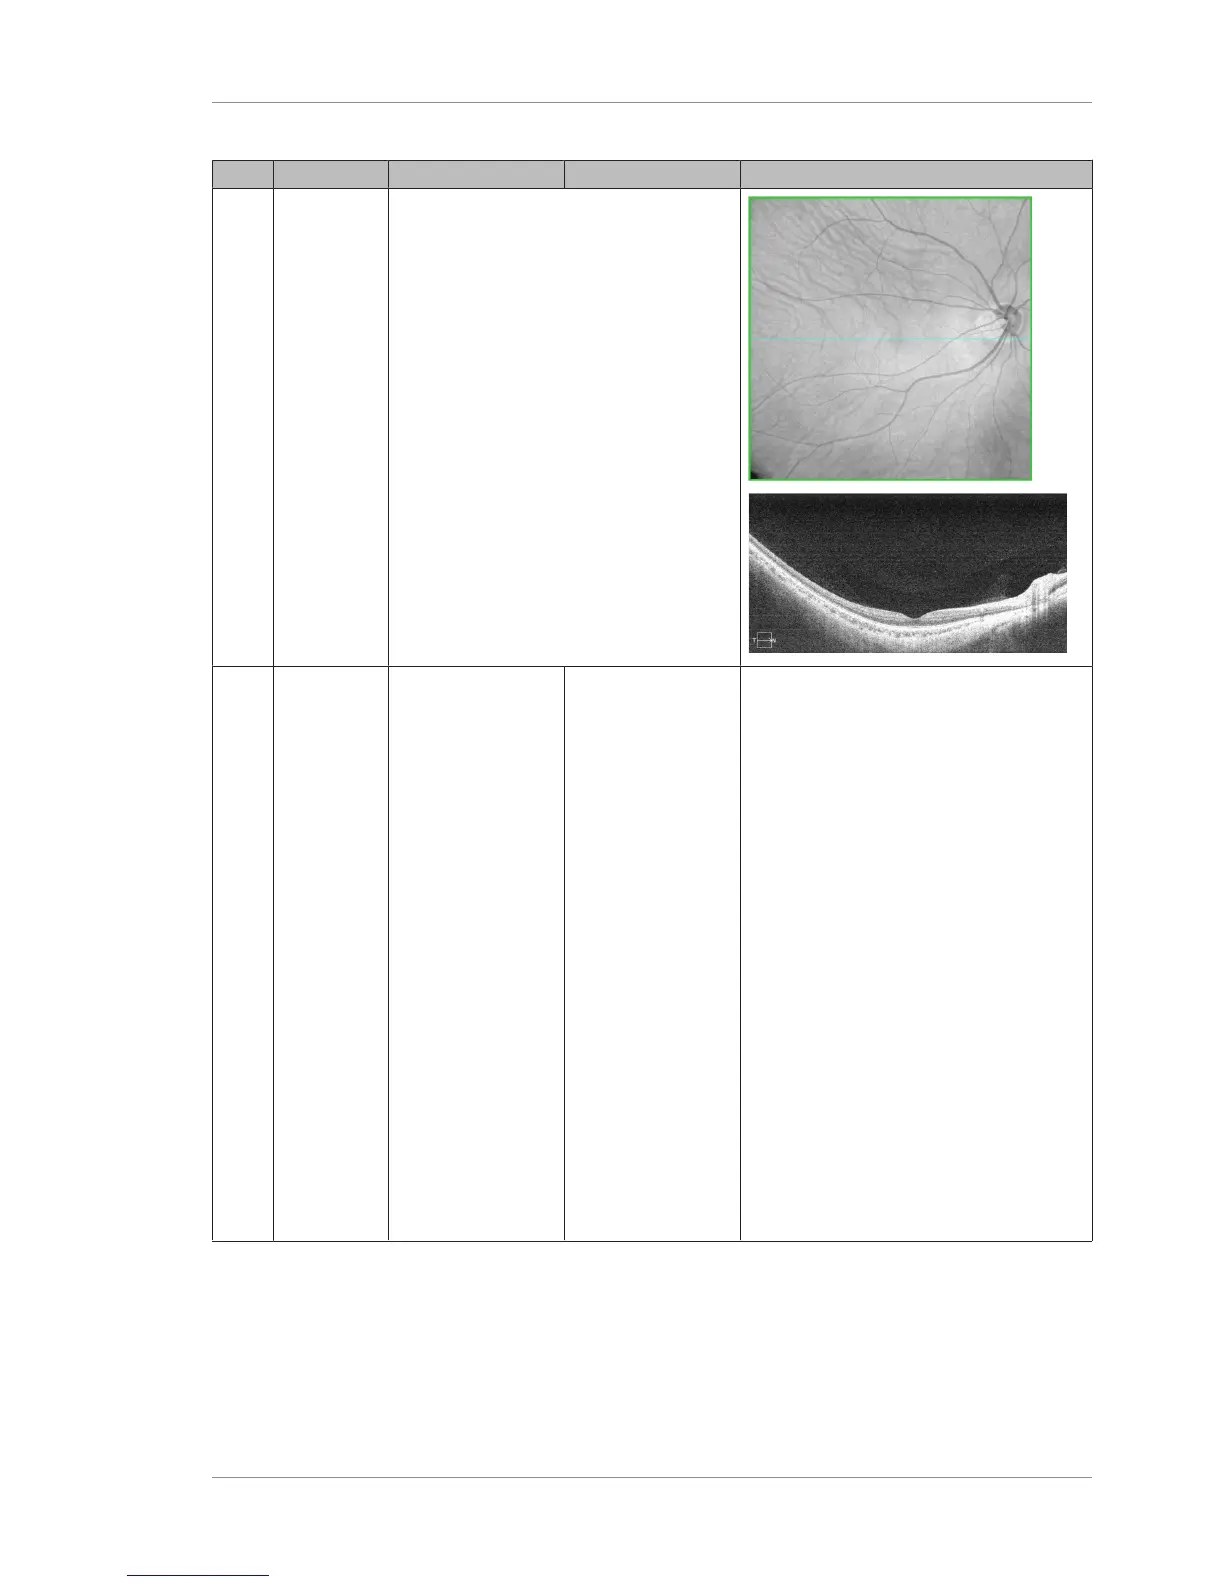
2 OCT Fundus
The struc-
tural view
of the
retina.
The colors of the ILM–RPE color bar
represent the depth in micrometers (µm),
ranging from 0 (blue) to 500 (white) in
increments of 25 µm for each bar.
3 VRI
Highlights
disorders of
the VRI
such as
epiretinal
membranes
(ERM) and
vitreo-
macular
traction
(VMT).
Vitreous
attachments
show as
bright
areas, and
macular
pucker
appears as
variations in
the
background
intensity.
133 μm above the
ILM layer
33 μm below the
ILM layer
 Loading...