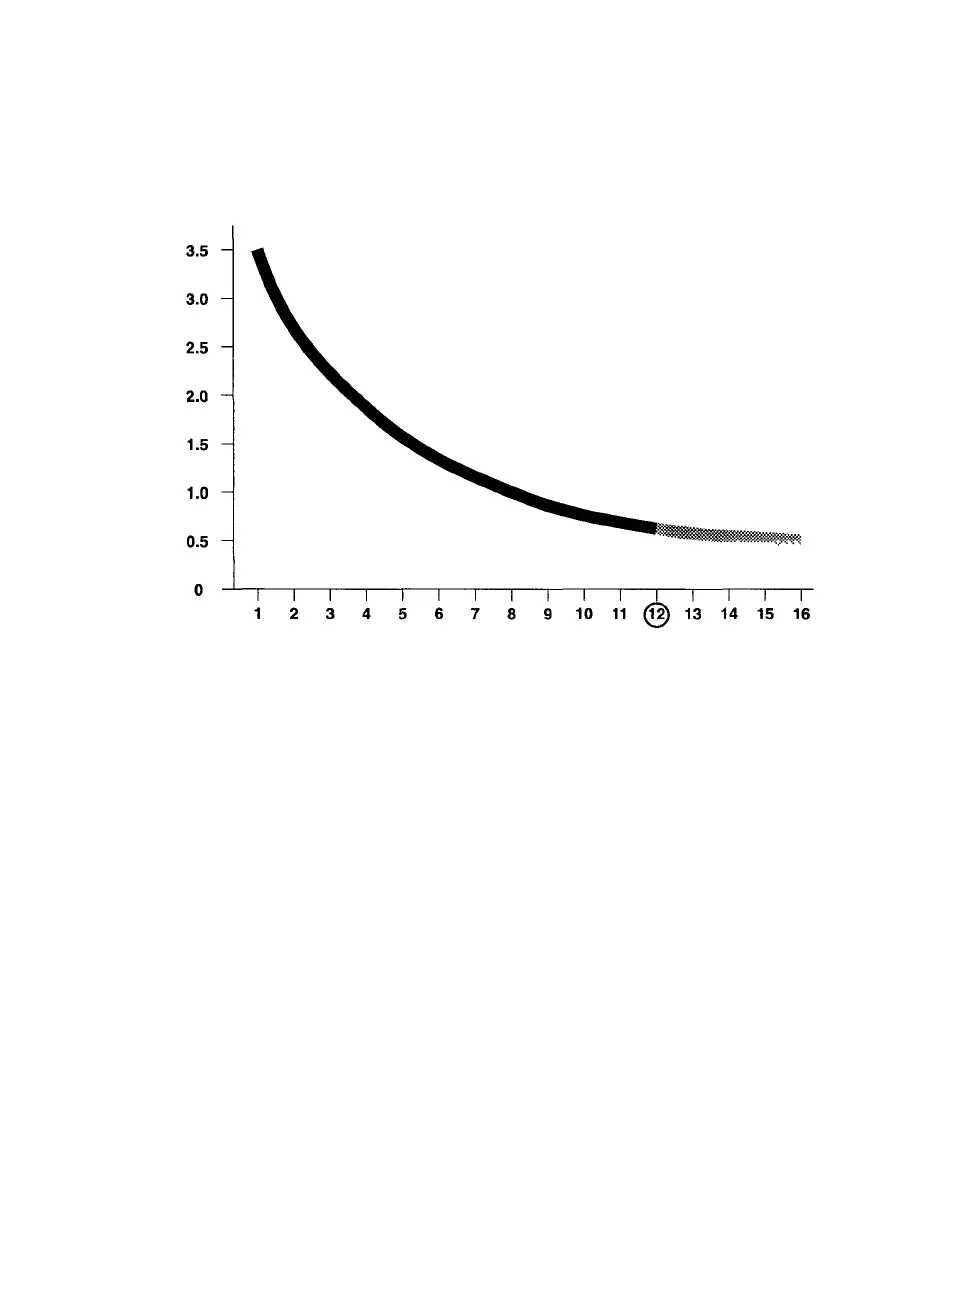
Response Curves
The response curve is plotted from the density readings taken from the
grayscale test image. See Figure 6.1, below.
Figure 6 1 A response curve for slide film
The vertical axis represents the measured density The horizontal axis represents
the box number in which the density was measured
Changes to contrast settings have the greatest effect on the densities
measured in boxes 1 through 11, indicated by the black section of the
curve above.
Changes to brightness settings have the greatest effect on the densi-
ties measured in boxes 12 through 16, the gray section in Figure 6.1.
Color Balance • 6-3