Contrast Control
The Contrast Control affects the slope of the curve. Adjusting the con-
trast control number causes the curve to pivot up or down at the white
point of the curve (usually box 16).
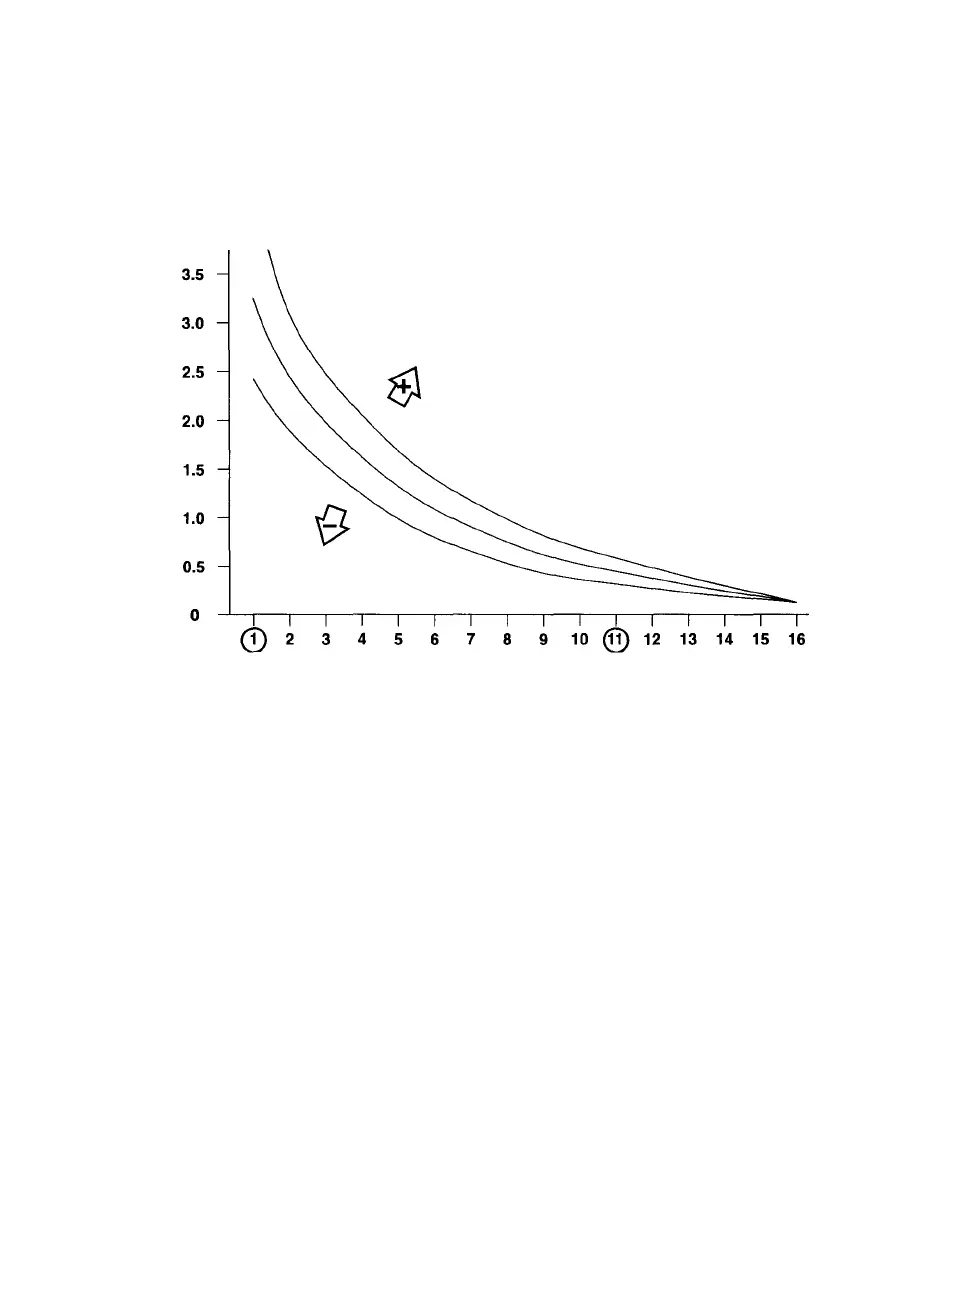
Figure 6.4. Changes to the contrast values have the greatest effect on the densities
measured in boxes one to eleven.
Contrast Units
Like the brightness values, the contrast values are arbitrary units rep-
resenting beam intensities for the three channels. Changes affect the
entire curve, but, unlike the brightness values, changes in contrast val-
ues are most apparent in boxes 1 through 11 (see Figure 6-4).
Examples of contrast values are the following:
Red: 69 Green: 91 Blue: 43
Color Balance • 6-9