Brightness Control
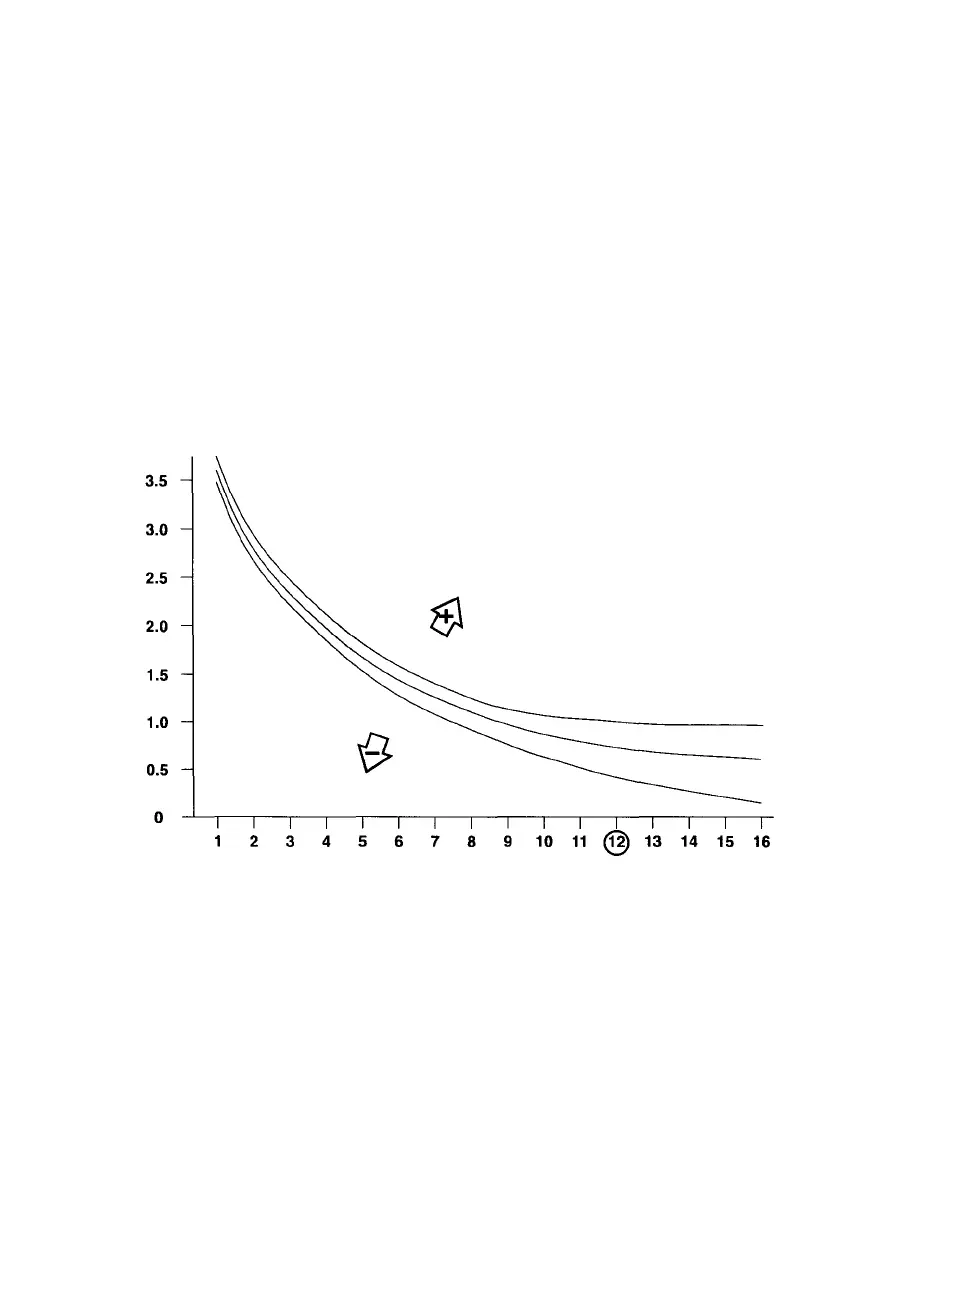
The Brightness Control enables you to shift the entire response curve
up and down (see Figure 6-3).
Use the Brightness controls to enter different brightness values, repeat
the test image, and measure until the lower portion of the curve is sat-
isfactory. Decreasing the values increases the brightness of the image.
Shift the curve to find an acceptable light grey balance point (Box 12)
and white point. The entire curve is affected when you change the
brightness value, but the greatest effects occur in boxes 12 through
16.
Figure 6 3 Changes to the brightness values have the greatest effect on the densi-
ties measured in boxes 12 to 16.
6-6 • PCR II Plus User Guide