QoS Policies
7210 SAS D, E, K OS Quality of Service Guide Page 69
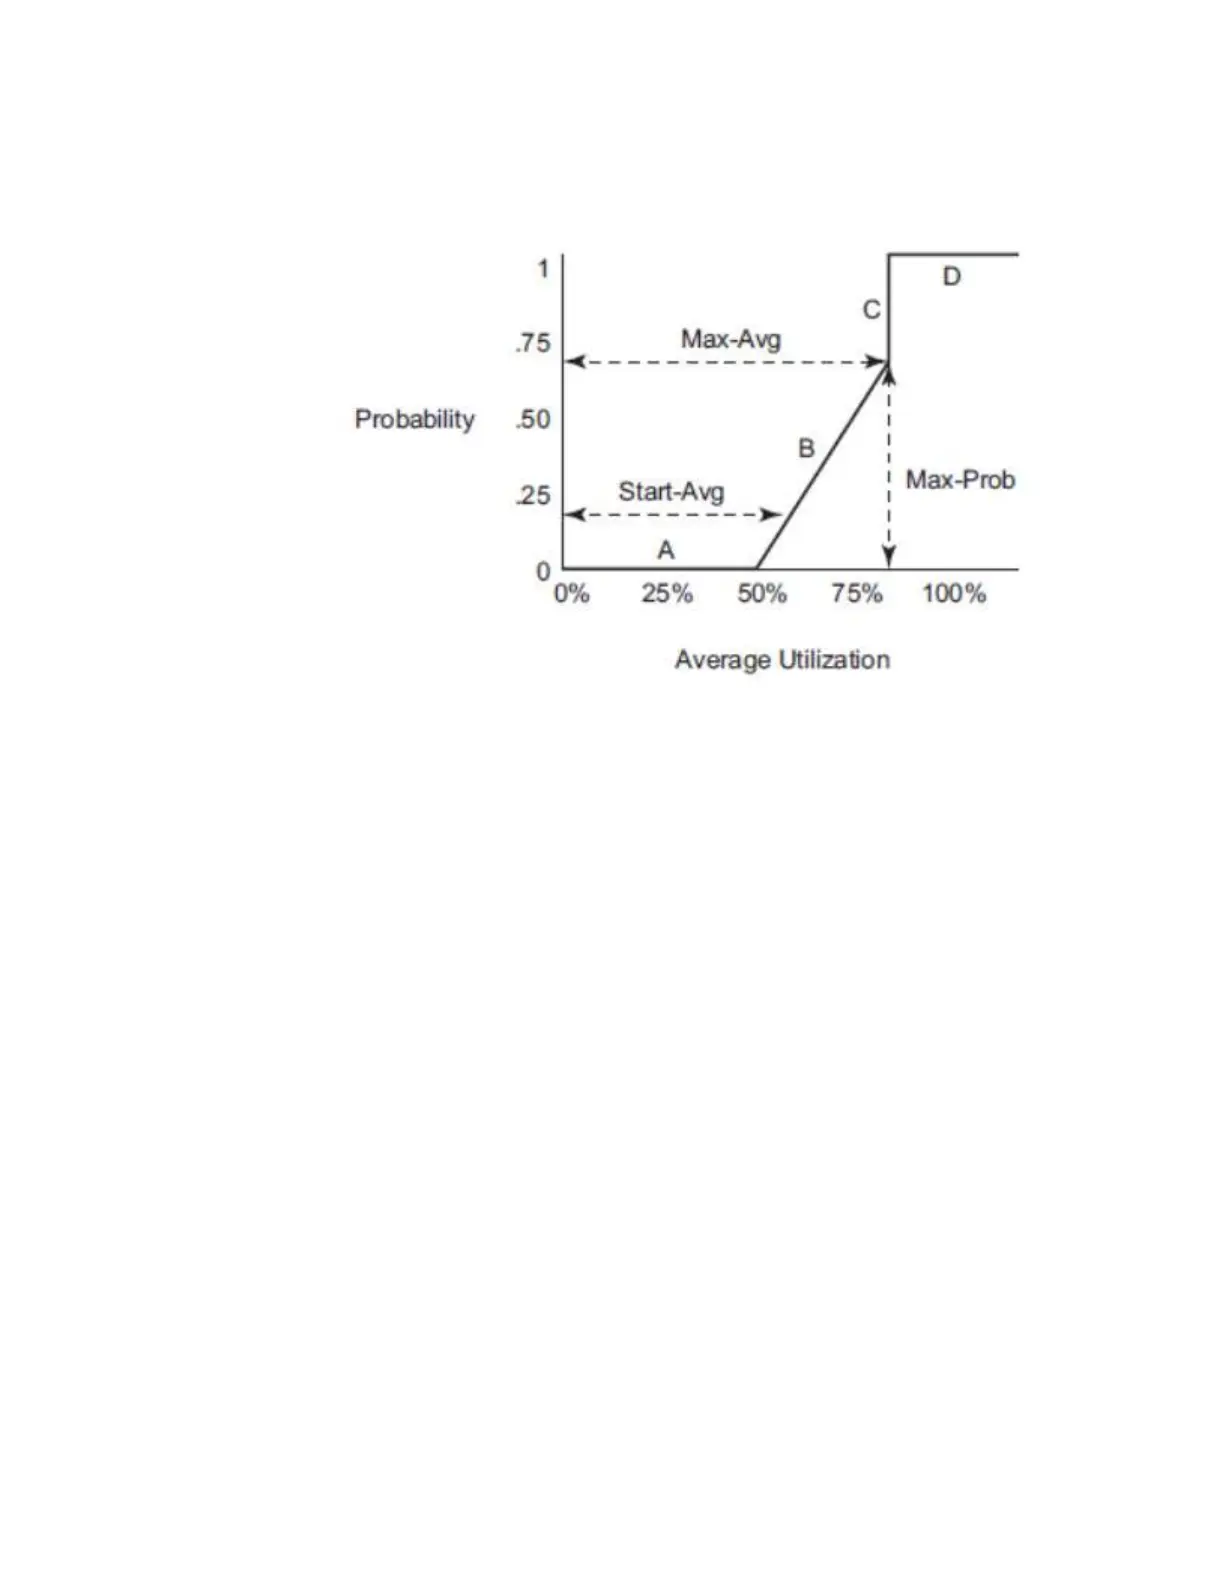
Figure 5: RED Slope Characteristics
A RED slope itself is a graph with an X (horizontal) and Y (vertical) axis. The X-axis plots the
percentage of shared buffer average utilization, going from 0 to 100 percent. The Y-axis plots the
probability of packet discard marked as 0 to 1. The actual slope can be defined as four sections in
(X, Y) points (Figure 5):
1. Section A is (0, 0) to (start-avg, 0). This is the part of the slope that the packet discard value
is always zero, preventing the RED function from discarding packets when the shared buffer
average utilization falls between 0 and start-avg.
2. Section B is (start-avg, 0) to (max-avg, max-prob). This part of the slope describes a linear
slope where packet discard probability increases from zero to max-prob.
3. Section C is (max-avg, max-prob) to (max-avg, 1). This part of the slope describes the instan-
taneous increase of packet discard probability from max-prob to one. A packet discard prob-
ability of 1 results in an automatic discard of the packet.
4. Section D is (max-avg, 1) to (100%, 1). On this part of the slope, the shared buffer average
utilization value of max-avg to 100% results in a packet discard probability of 1.
Plotting any value of shared buffer average utilization will result in a value for packet discard
probability from 0 to 1. Changing the values for start-avg, max-avg and max-prob allows the
adaptation of the RED slope to the needs of the access or network queues using the shared portion
of the buffer pool, including disabling the RED slope.
 Loading...