UG-1828 Preliminary Technical Data
Rev. PrC | Page 316 of 338
Captured Data Format
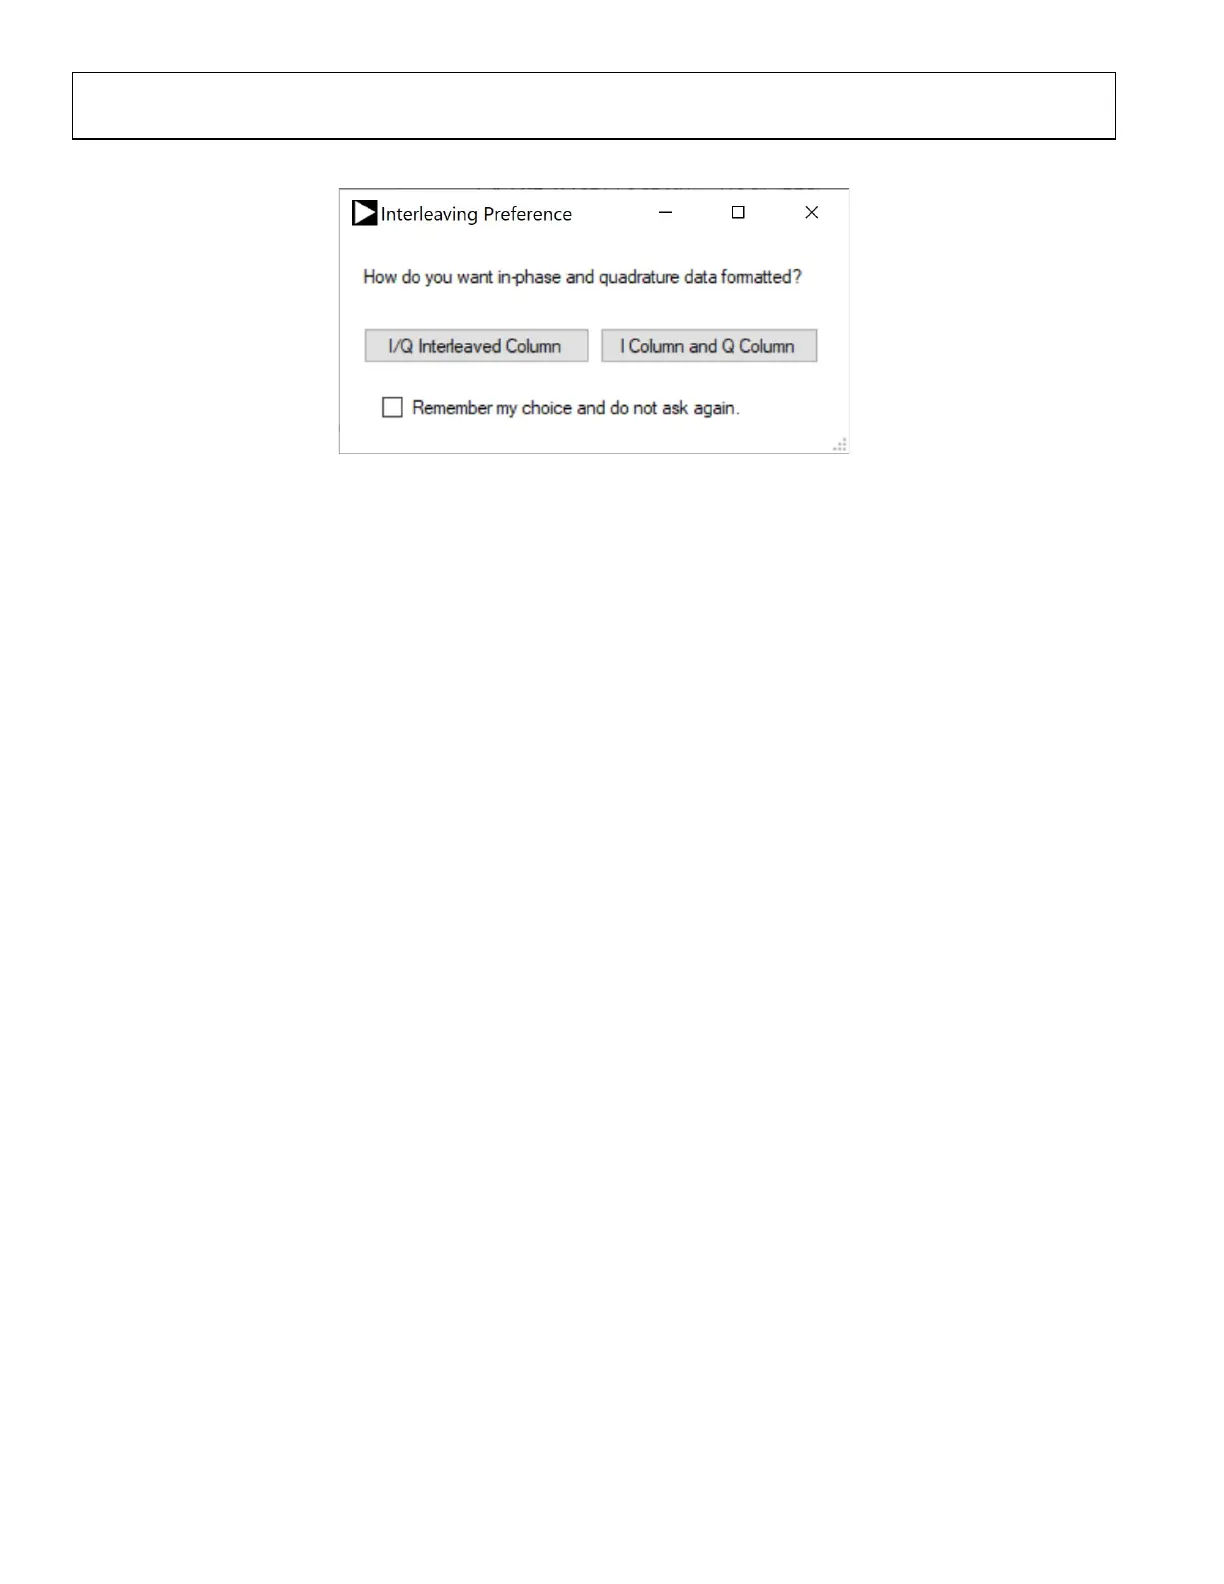
Figure 302. Interleaving Option
RX captured data can be saved using the save button next to the play button. The data is saved in either tsv or csv format. Each column
corresponds to one channel. Data samples follow 1Q15 fixed point format, when the user selects the interleaved option. Shown as follows:
Channel 1 | Channel 2
----------|-----------
I1 | I1
Q1 | Q1
I2 | I2
Q2 | Q2
. | .
. | .
. | .
When the I and Q column option is selected the data is formatted as follows:
Channel 1I | Channel 1Q
----------|-----------
I1 | Q1
I2 | Q2
I3 | Q3
I4 | Q4
. | .
. | .
. | .
In the case of RX frequency deviation, only I samples are shown, all Q samples are 0.
Observer Operation
The Observe tab opens a window as shown in Figure 303. The upper plot displays the FFT of the received input data and the lower plot
shows its time domain waveform. This tab operates the very same as the Receive tab above. It is used to observe the Transmitted signals.
Enable this tab by selecting the I/Q Signal Type in the Device Configuration tab when setting up the device parameters. The user needs to
start transmitting from the Transmit tab before being able to press the ‘play’ button in the observe tab.
 Loading...