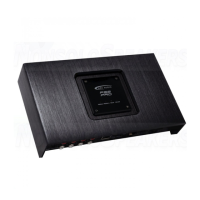
12.6.10.11 - Parametric EQ Band Variable "Q" Slider
When in Parametric EQ mode, the "Q" Slider
(See diagram 12.51) allows users to select the user denable
"Q" or bandwidth of the individual band’s frequency center that is highlighted above in the individual
band frequency display
Users may dene the individual band’s "Q" by clicking on the slider and using the arrow keys to select
the desired level, or by clicking on the slider and dragging it to the desired "Q" level. Users may pick
any level of "Q" from .1 - 24.0, with .1 being the widest "Q" and 24.0 being super narrow allowing for
frequency based notch lters. The level of "Q" is displayed in the "Q" value display window
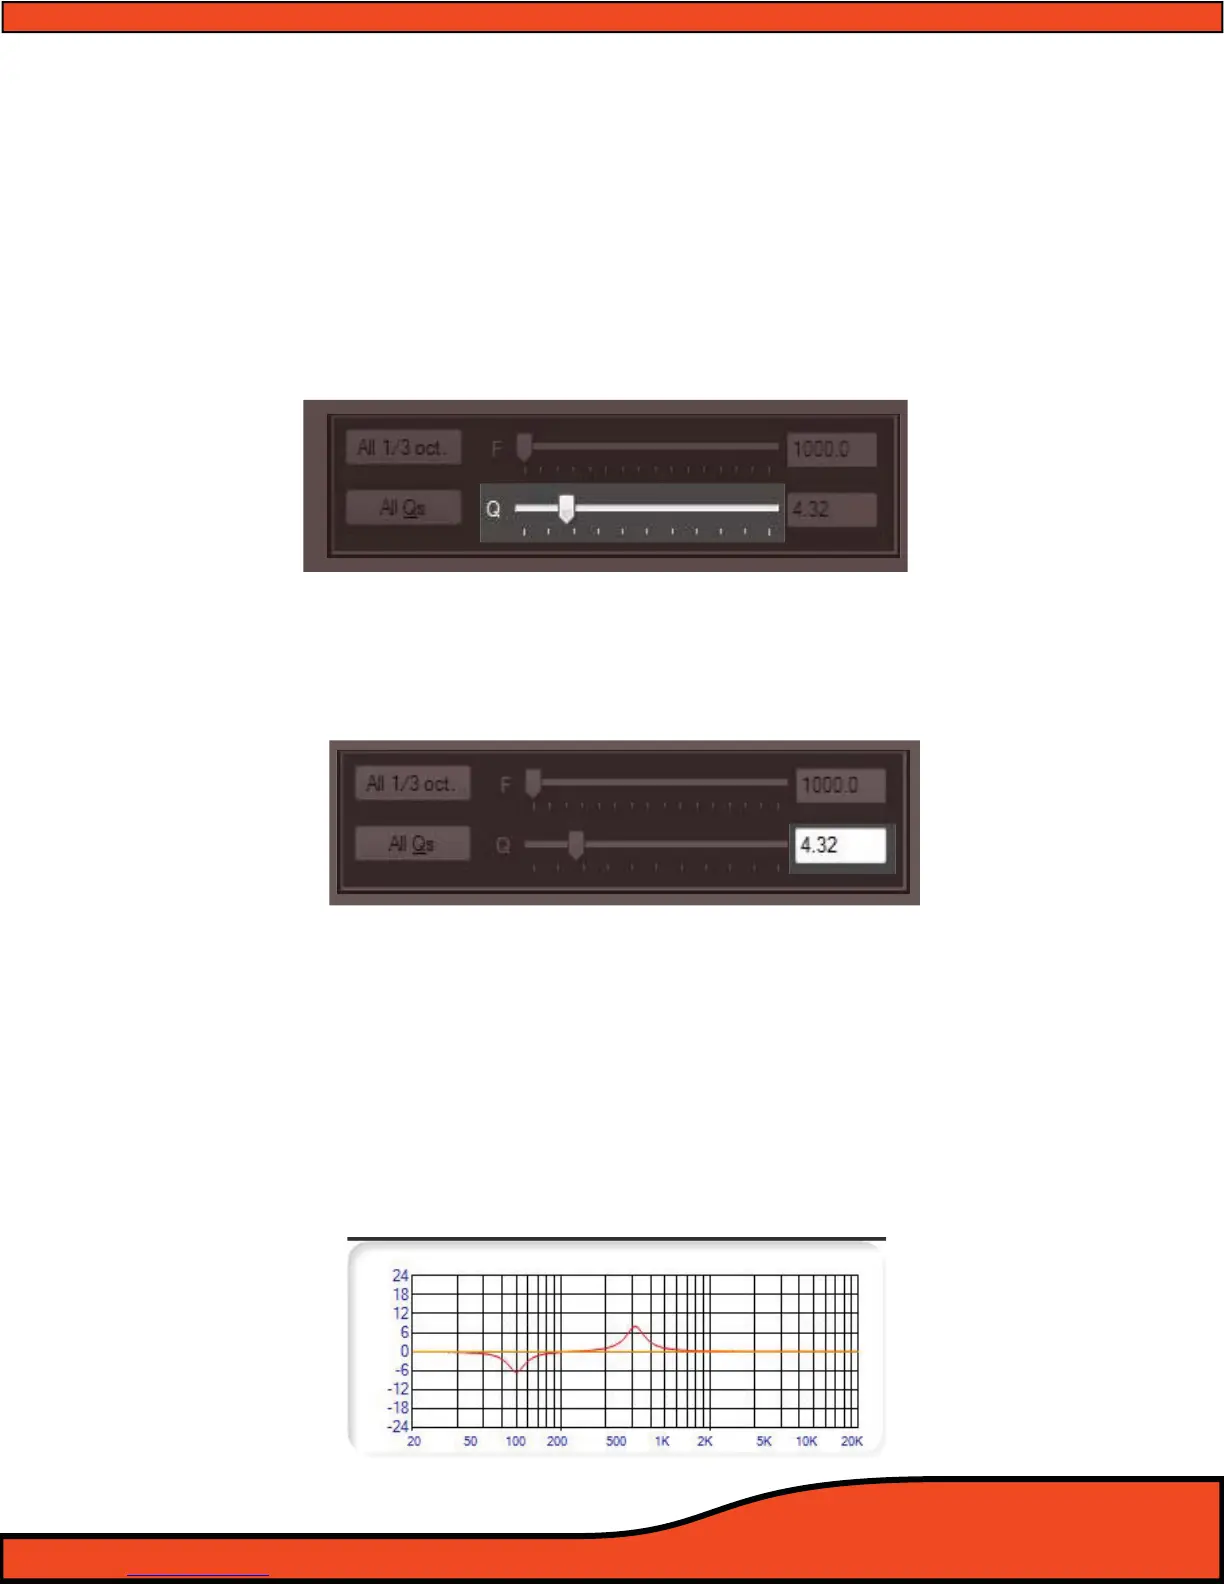
12.6.10.12 - Parametric EQ Band Variable "Q" Value Display
The "Q" value display
(See diagram 12.52) will show the current level for the highlighted band that is
selected in the individual band frequency display
12.6.10.13 - EQ Frequency Plotting Chart Display
The PS8 gives users the ability to visually see the individual and grouped response curves of their EQ
settings by clicking on any one of the EQ Plot channel selection boxes
. By checking on the desired
channels check boxes, the EQ plot graph will be displayed in corresponding colors to the individual
channels.
(See diagram 12.53)
Note: that this is not an RTA device and will only show the graph of the individual specied EQ settings made by the
user. This function is a wonderful tool when using the EQ in parametric mode to help prevent any unwanted peaks and
abnormal gains as a result of overlapping "Q"s in the EQ section of the processor.
Diagram 12.51
Diagram 12.52
Diagram 12.53