Chapter 5: Cytometer QC and Setup 85
7 Select all fluorescence histograms on the Unstained Control worksheet.
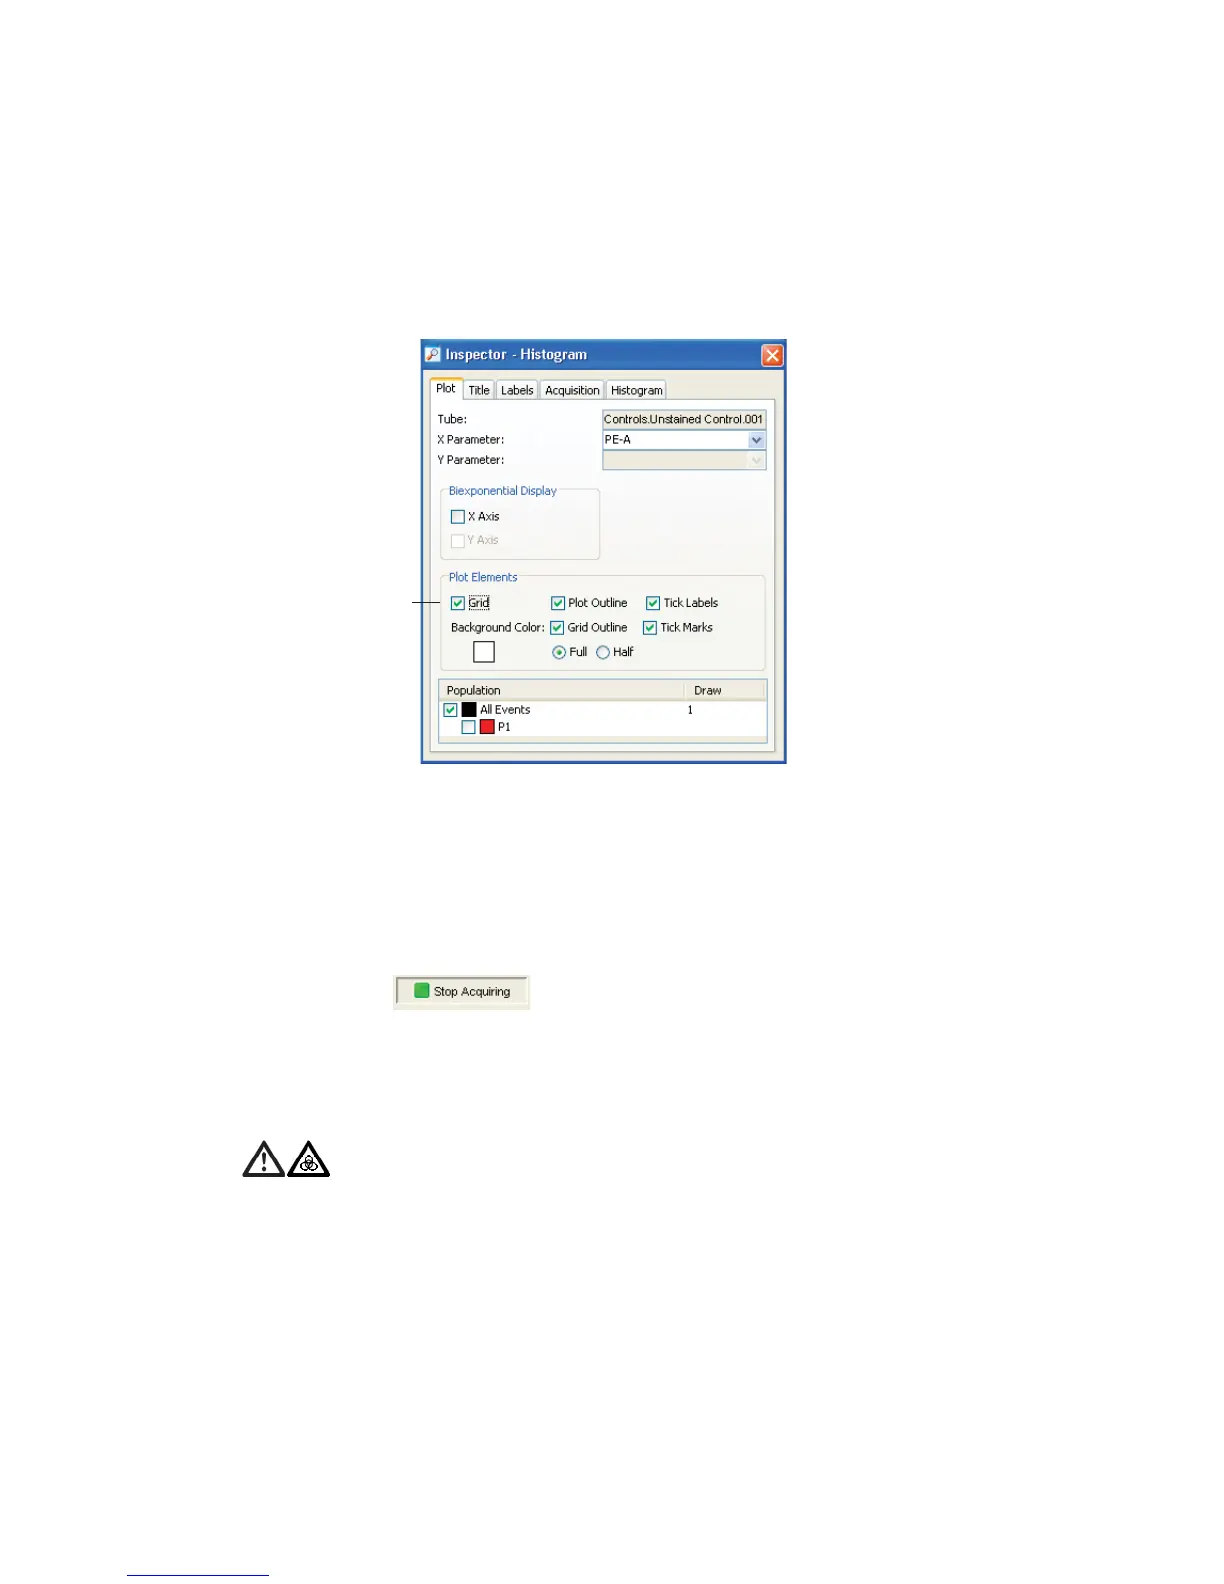
8 In the Plot Inspector, select the Grid checkbox:
Gridlines are used to delineate log decades on plots. In a four-log display,
values are displayed from 26–262,143. Thus, the first log decade ranges
from 26–262. The lines are shown only in plots that display log parameters.
9 Optimize the voltages to place the negative population for each fluorescent
parameter on scale.
10 Click to stop acquisition.
11 When acquisition stops, remove the unstained control tube.
• Hold the sample tube while you push the aspirator arm to the left.
• Remove the tube from the SIT.
If you move the arm without holding the tube, the tube could fall off the
SIT and expose you to potentially biohazardous sample.
checkbox
selected