SmartFlex
If a neighboring cell is highlighted in red, there is a risk that the router may repeatedly
switch between the neighboring cell and the primary cell. This can affect the performance of
the router. To prevent this, re-orient the antenna or use a directional antenna.
The next section of this window displays historical information about the quality of the cel-
lular WAN connection during each logging period. The router has standard intervals, such as
the previous 24 hours and last week, and also includes information one user-defined interval.
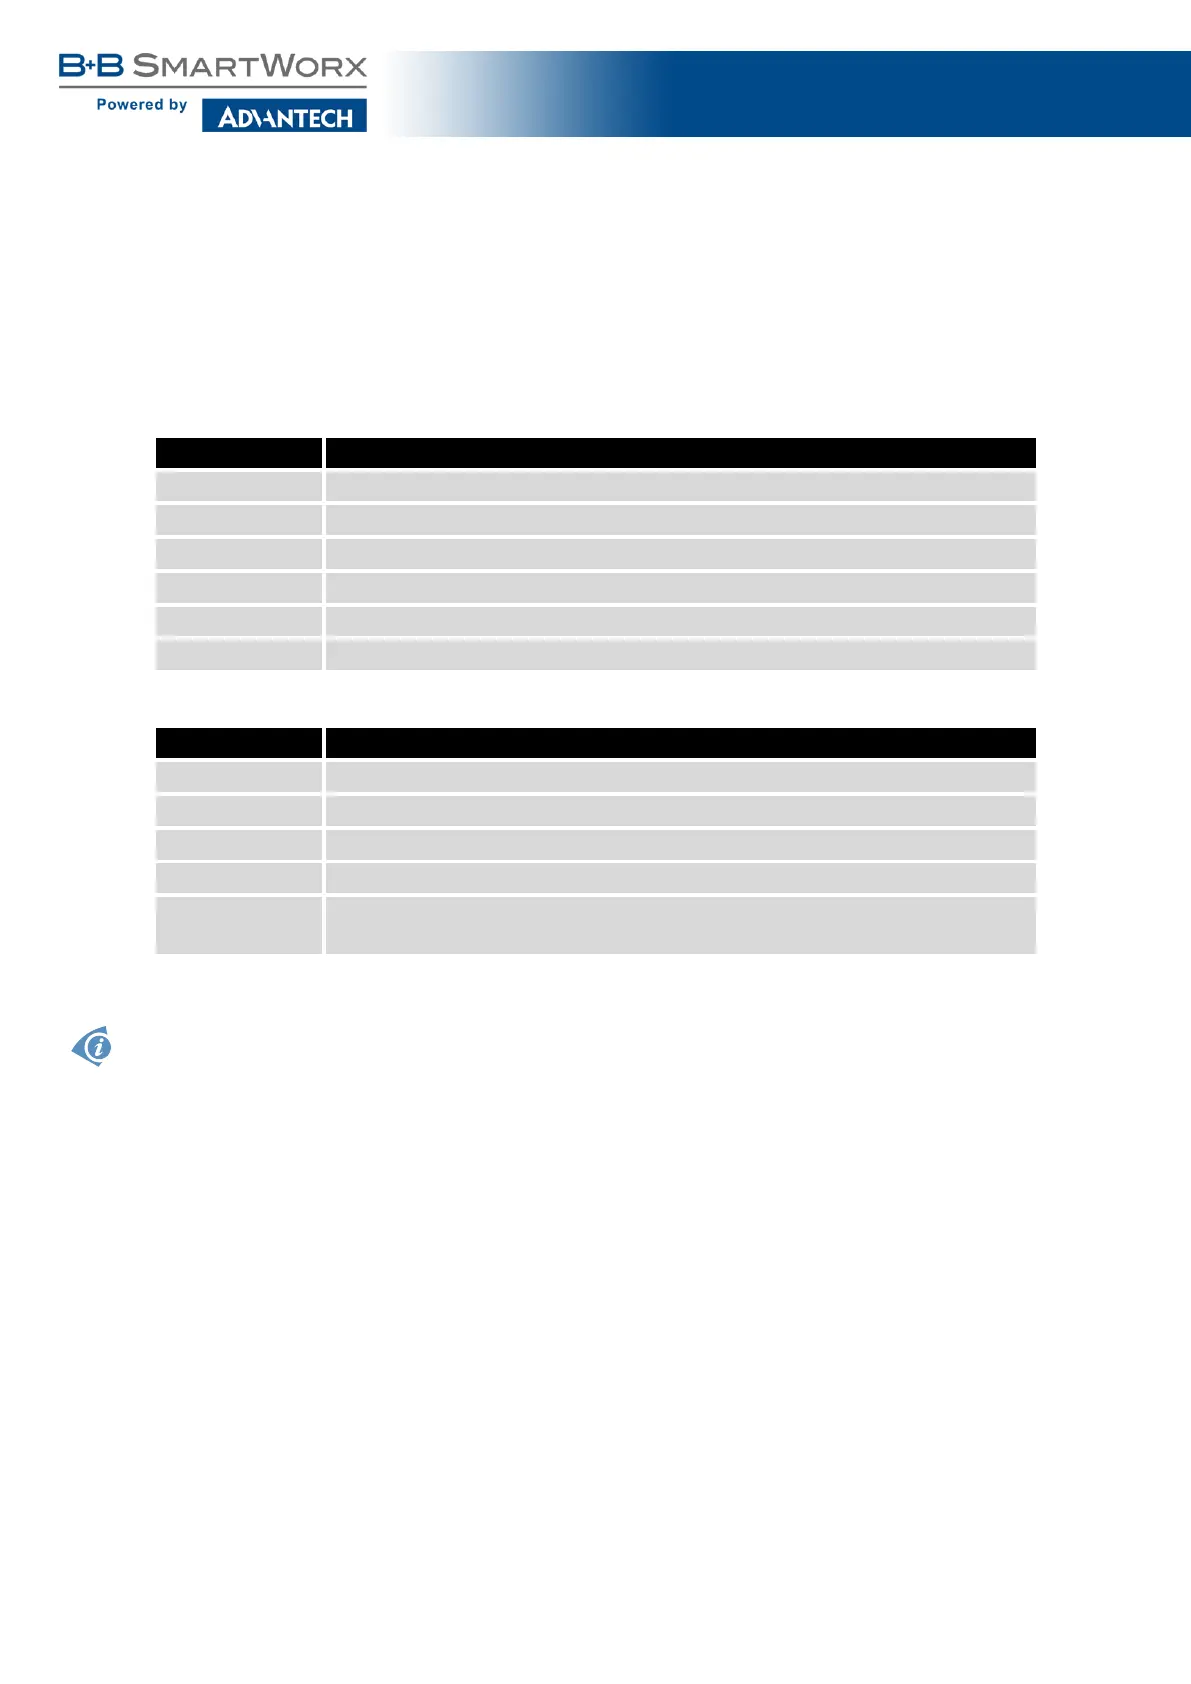
Period Description
Today Today from 0:00 to 23:59
Yesterday Yesterday from 0:00 to 23:59
This week This week from Monday 0:00 to Sunday 23:59
Last week Last week from Monday 0:00 to Sunday 23:59
This period This accounting period
Last period Last accounting period
Table 6: Description of Periods
Item Description
Signal Min Minimal signal strength
Signal Avg Average signal strength
Signal Max Maximal signal strength
Cells Number of switch between cells
Availability Availability of the router via the mobile network (expressed as a percent-
age)
Table 7: Mobile Network Statistics
Tips for Mobile Network Statistics table:
• Availability is expressed as a percentage. It is the ratio of time connection to the mobile
network has been established to the time that router has been is turned on.
• Placing your cursor over the maximum or minimum signal strength will display the last
time the router reached that signal strength.
11

 Loading...