Noise Tests
Copper and G.fast/VDSL2/ADSL2+ Multi-play Test Set 195
WB Impulse Noise
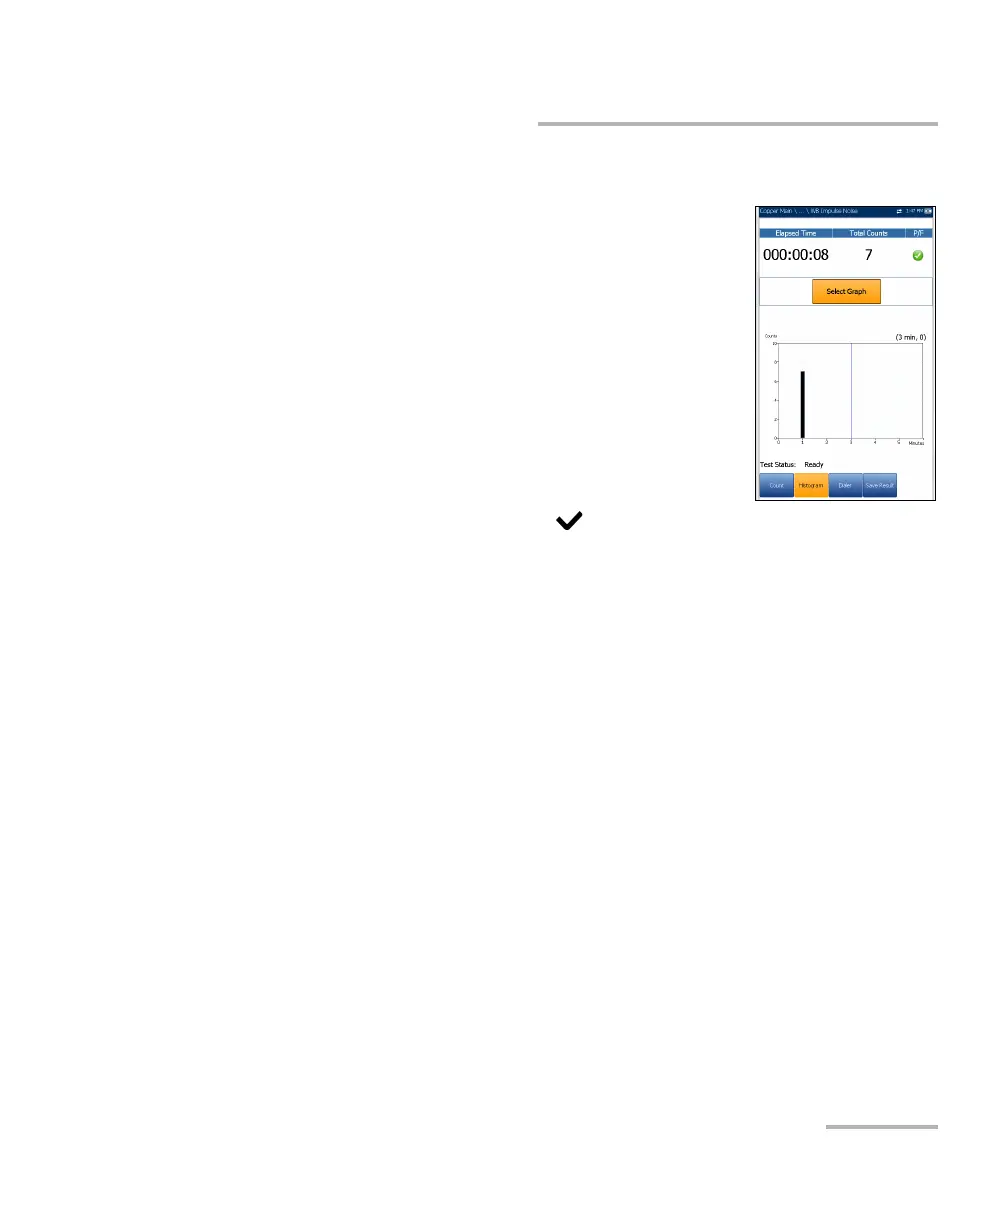
Histogram
The Histogram tab records the Elapsed Time, the
Total Counts of impulse durations that are collected
during each plot interval, and pass/fail status. The bar
graph displays the impulse counts vs time.
Select Graph button changes to Graph Selected
when pressed and opens a new selection of function
keys which allow you to maneuver the graph as
follows:
Cursor - press the left/right arrow keys to
decrease/increase the values by moving the
cursor. Press and hold the left/right arrow keys to
accelerate the cursor. Press to recall the cursor and place it in the
middle of the current x-axis limits.
Zoom references the middle of the x/y axis and not the cursor position.
Press the arrow keys as follows:
Right = x-axis zoom in.
Left = x-axis zoom out.
Up = y-axis zoom in.
Down = y-axis zoom out.
Pan - use left/right arrow keys to pan the x-axis and the up/down arrow
keys to pan the y-axis.
1:1 resets the x-axis and y-axis limits to full scale.
Return To Test removes these function keys and displays the previous
ones.