Running DSL/IP Tests and Viewing Results
Copper and G.fast/VDSL2/ADSL2+ Multi-play Test Set 395
Loop Diagnostics
Loop Diagnostics
The Loop Diagnostics tab displays the characteristics
and potential problems on the line, in graphical
format. Some DSLAMs provide upstream SNR and
Hlog per tone info to the CPE during DSL connection
phase. If the SNR/Hlog/QLN info is available, the
upstream and downstream diagnostic data is
displayed using different colors which are identified in
the graph. For VDSL2/ADSL2+, Frequency is shown in
kHz. If G.fast, the Frequency is shown in MHz. There
are 4 (when in G.fast mode) separate graphs for
each pair:
SNR per Tone presents the signal-to-noise ratio
per tone.
ATTN (Hlog) per Tone shows the attenuation from Hlog (Channel
Response) per tone.
QLN per Tone shows the PSD noise from quiet line noise per tone.
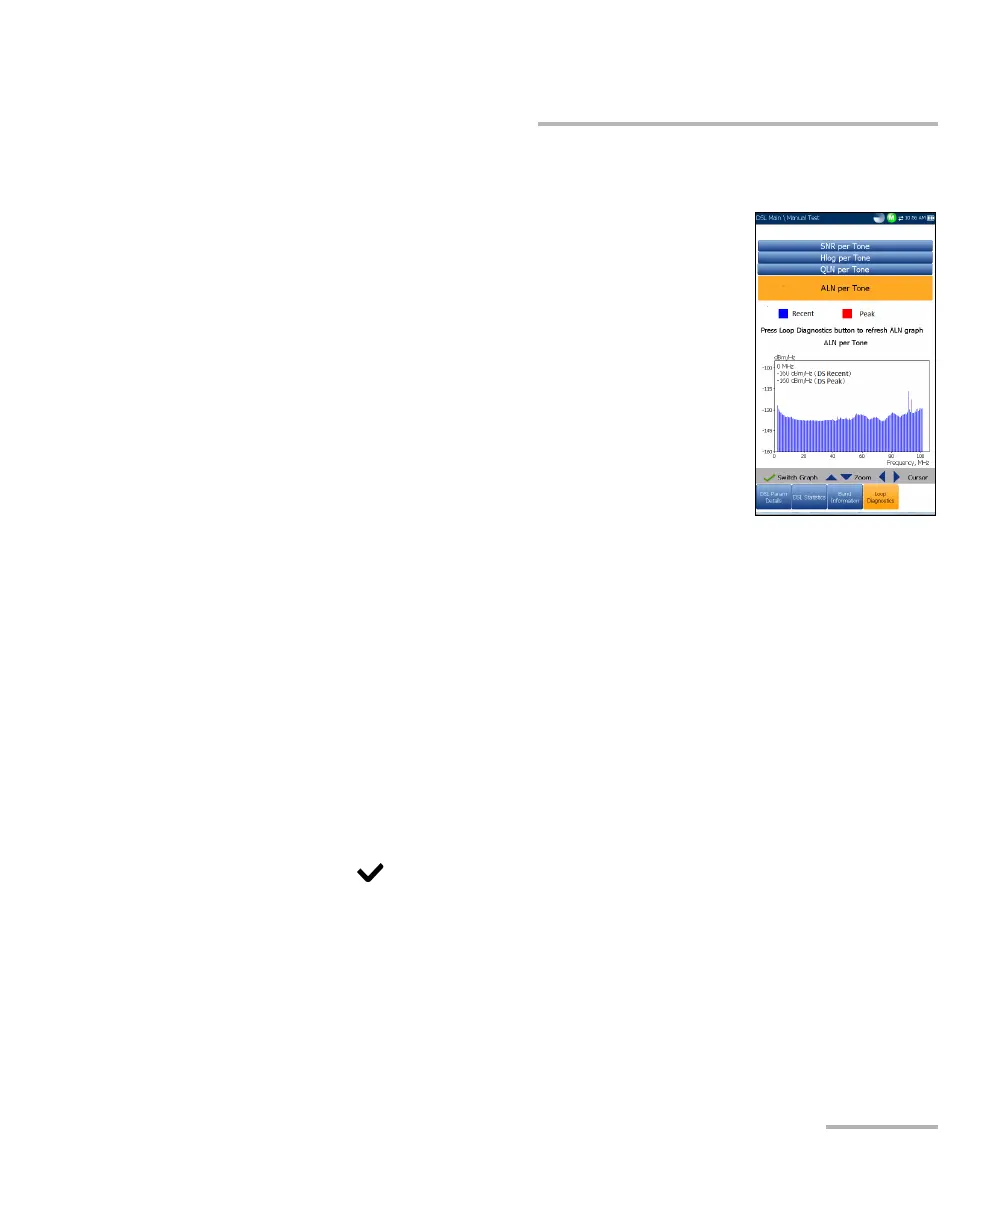
ALN per Tone defines the downstream active line noise per tone and is
displayed as 2 sets of data:
Recent based on the most recent refresh values. Press the Loop
Diagnostics tab to refresh the ALN graph.
Peak which shows the maximum values registered for each tone
since the test started; that is initial and consequent refresh graphs.
Press to switch between graphs.