6. Diagnostics and optimization
6−42
Festo P.BE−SPC200−WIN−PISA−CD−EN en 0901d
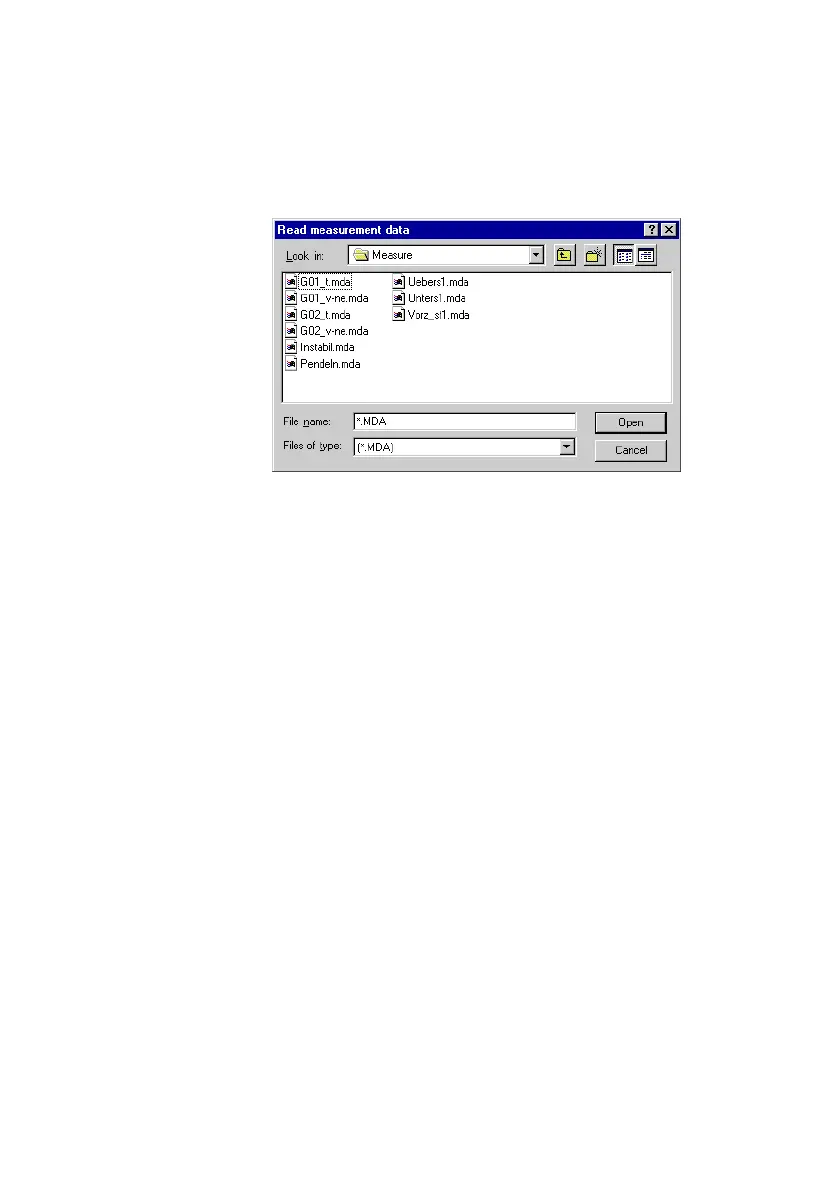
Fig.6/19: Loading measurement data
Click on the Close" button to remove the measurement data
on the current tab from the Data basis" dialogue window.
The source of the measurement values will be displayed at
the top of the tab. The individual measured variables are
listed below this. You can switch to the measurement values
for
the respective axis using the X" and Y" option buttons
where measurement values for more than one axis are dis
played.
Lay out the measurement variables in the Diagram layout"
area in the way that they will be displayed in the graph.