6. Diagnostics and optimization
6−43
Festo P.BE−SPC200−WIN−PISA−CD−EN en 0901d
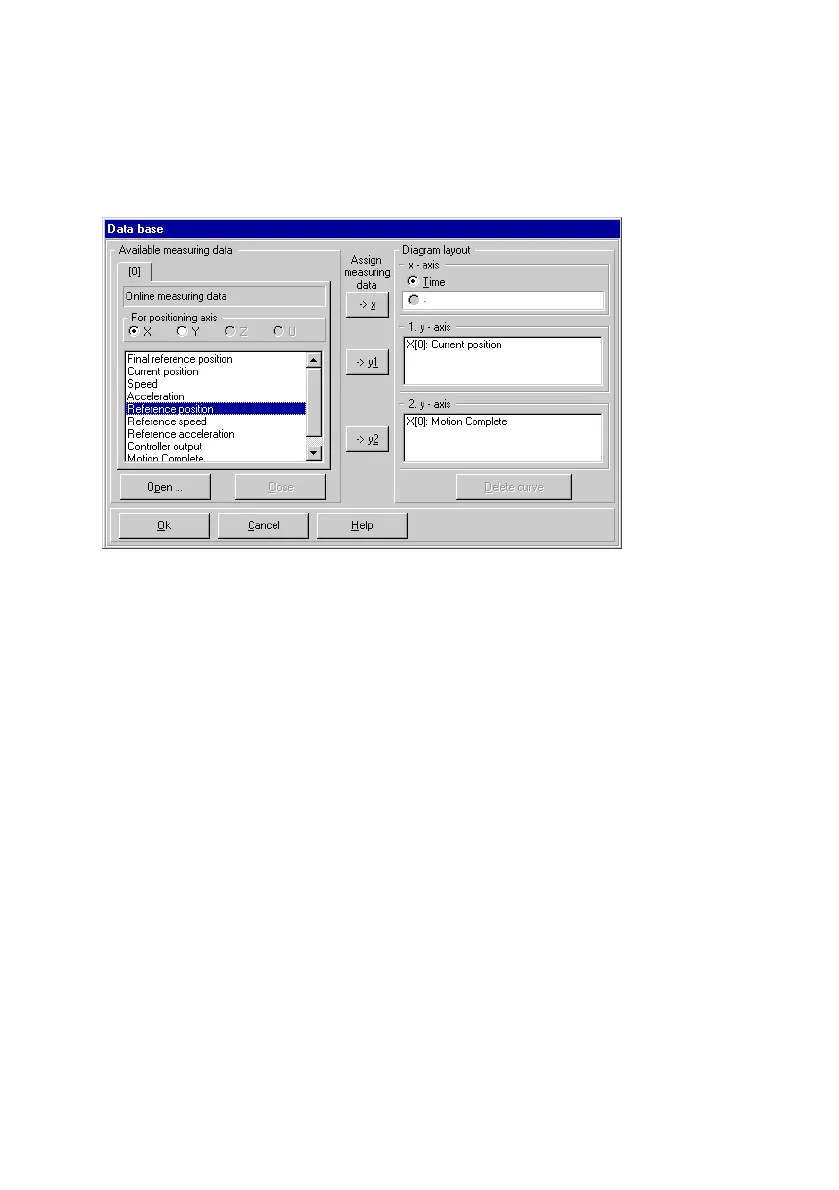
Fig.6/20: Diagram layout
Specify the unit of measurement for the X−axis (abscissa) of
the graph under X−axis". Select time or any other measure
ment variable from the Existing measurement data" range as
the unit of measurement. Assign these values to the X−axis
by using the −>x" button.
Specify the measurement variables to be displayed
in the
graph as curves in the 1. Y−axis" and 2. Y−axis" fields. You
can use two ordinate axes and thus two different scales on
each graph by dividing this into two y−axes (ordinates).
To display a measurement variable, select it from Available
measurement data" and accept it for the axis concerned
using
−>y1" or " −>y2".
To remove a measurement variable from the Diagram lay
out" area, select this variable and click the Delete curve"
button to remove it.
Click on OK" to confirm the settings. The graph specified will
be displayed in a new graphic window.