INDOOR AIR QUALITY FUNDAMENTALS
155
ENGINEERING MANUAL OF AUTOMATION CONTROL
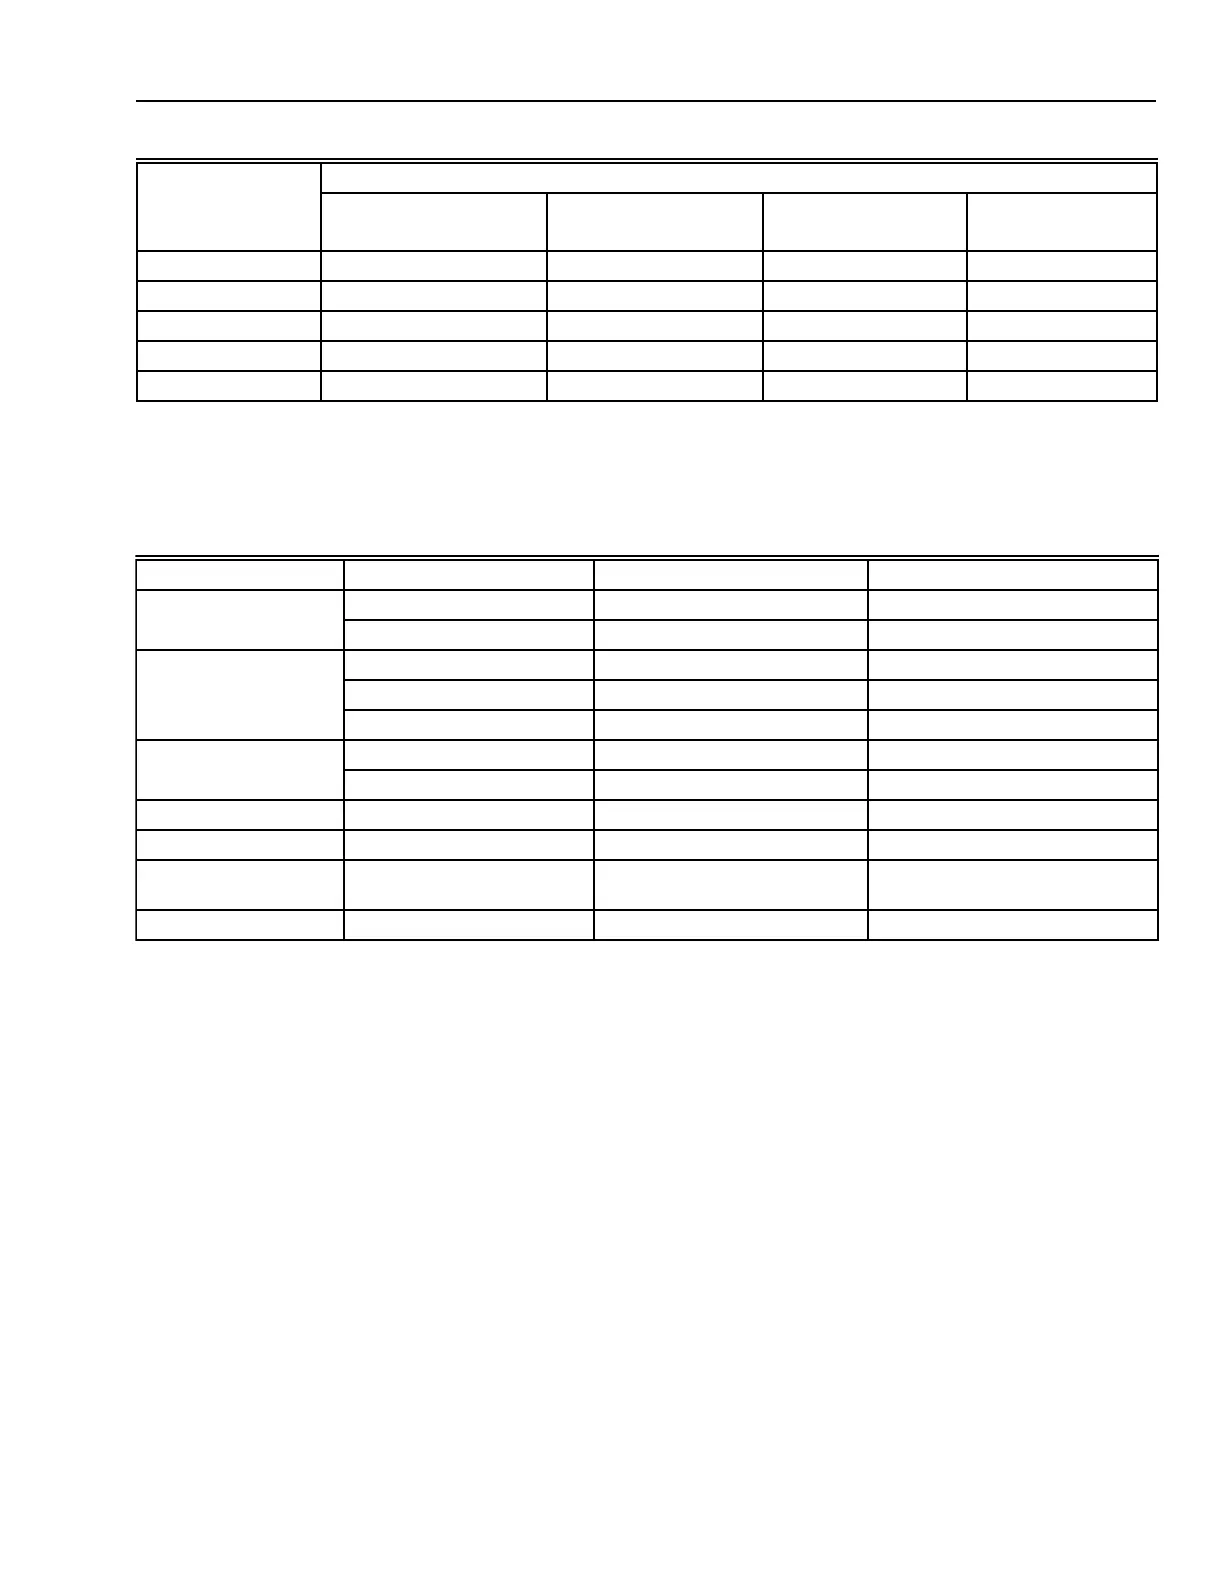
Table 2. U.S. Ambient Air Quality Standards.
Table 1. Annual Median Concentrations for TSP, NO
2
, O
3
, & CO—1979.
a
(continued)
Indoor Contaminant Sources
GENERAL
Indoor contaminant sources are generated by the occupants,
the processes conducted, construction, renovation and
maintenance activities, and the building materials and furnishings.
BUILDING MATERIALS AND FURNISHINGS
Building materials and furnishings generate Volatile Organic
Compounds (VOCs) including 4 to 16 carbon alkanes,
chlorinated hydrocarbons, alcohols, aldehydes, ketones, esters,
terpenes, ethers, aromatic hydrocarbons (e.g. benzene and
toluene), and heterocyclics. Building generated contaminants
are highest immediately after installation, reducing to a lower
level due to off gassing and ventilation, and then remain at that
level for an extended period.
However, the VOC concentrations increase during
unoccupied night and weekend periods when there is no
ventilation. Also, increased temperature increases the output
of VOCs from building materials. Table 3 lists Sources, Possible
Concentrations, and Indoor to Outdoor Concentration Ratios
of some indoor Pollutants (source: NRC 1981).
Concentrations listed are only those reported indoors. Both
higher and lower concentrations have been measured. No
averaging times are given. NA indicates it is not appropriate to
list a concentration.
For a detailed discussion of air contaminants refer to
ASHRAE Fundamentals Handbook 1997 Chapter 9, Indoor
Environmental Health and Chapter 12, Air Contaminants.
Concentration
µg/m
3
mg/m
3
Location TSP (annual average)
b
NO
2
(1 hr average)
O
3
(1 hr average)
CO (1 hr average)
Pittsburgh 88-162
—
29
d
3.9
St. Louis 63-107 90 (d) 22
d
2.3
d
San Diego 57-75 69 39 1.1
San Francisco 51 46 20
e
2.1
Washington DC 47-70 52 29 1.6
a
EPA (1980)
b
Annual geometric mean of 24 hr averages
c
24 hr averages
d
Not a full year
e
Total oxidants Source: Walden and Schiff (1983)
Pollutant Averaging Time Primary Standard Levels Secondary Standard Levels
Particulate matter Annual (geometric mean) 75 µg/m
3
60 µg/m
3
24 hr
b
260 µg/m
3
150 µg/m
3
Sulfur oxides Annual (arithmetic mean) 80 µg/m
3
(0.03 ppm) —
24 hr
b
365 µg/m
3
(0.14 ppm) —
3 hr
b
—
1300 µg/m
3
(0.5 ppm)
Carbon monoxide 8 hr
b
10 mg/m
3
(9 ppm) 10 mg/m
3
(9 ppm)
1 hr
b
40 mg/m
3
(35 ppm)
c
40 mg/m
3
(35 ppm)
Nitrogen dioxide Annual (arithmetic mean) 100 µg/m
3
(0.05 ppm) 100 µg/m
3
(0.05 ppm)
Ozone 1 hr
b
240 µg/m
3
(0.12 ppm) 240 µg/m
3
(0.12 ppm)
Hydrocarbons
(nonmethane)
a
3 hr
(6 to 9 A.M.)
160 µg/m
3
(0.24 ppm) 160 µg/m
3
(0.24 ppm)
Lead 3 months 1.5 µg/m
3
1.5 µg/m
3
a
A nonhealth-related standard used as a guide for ozone control.
b
Not to be exceeded more than once a year.
c
EPA has proposed a reduction of the standard to 29 µg/m
3
(25 ppm).
Source: U.S. Environmental Protection Agency.