ENGINEERING MANUAL OF AUTOMATIC CONTROL
BUILDING MANAGEMENT SYSTEM FUNDAMENTALS
194
Whereas building control strategies are often established
independent of who will be “operating” the building, operator
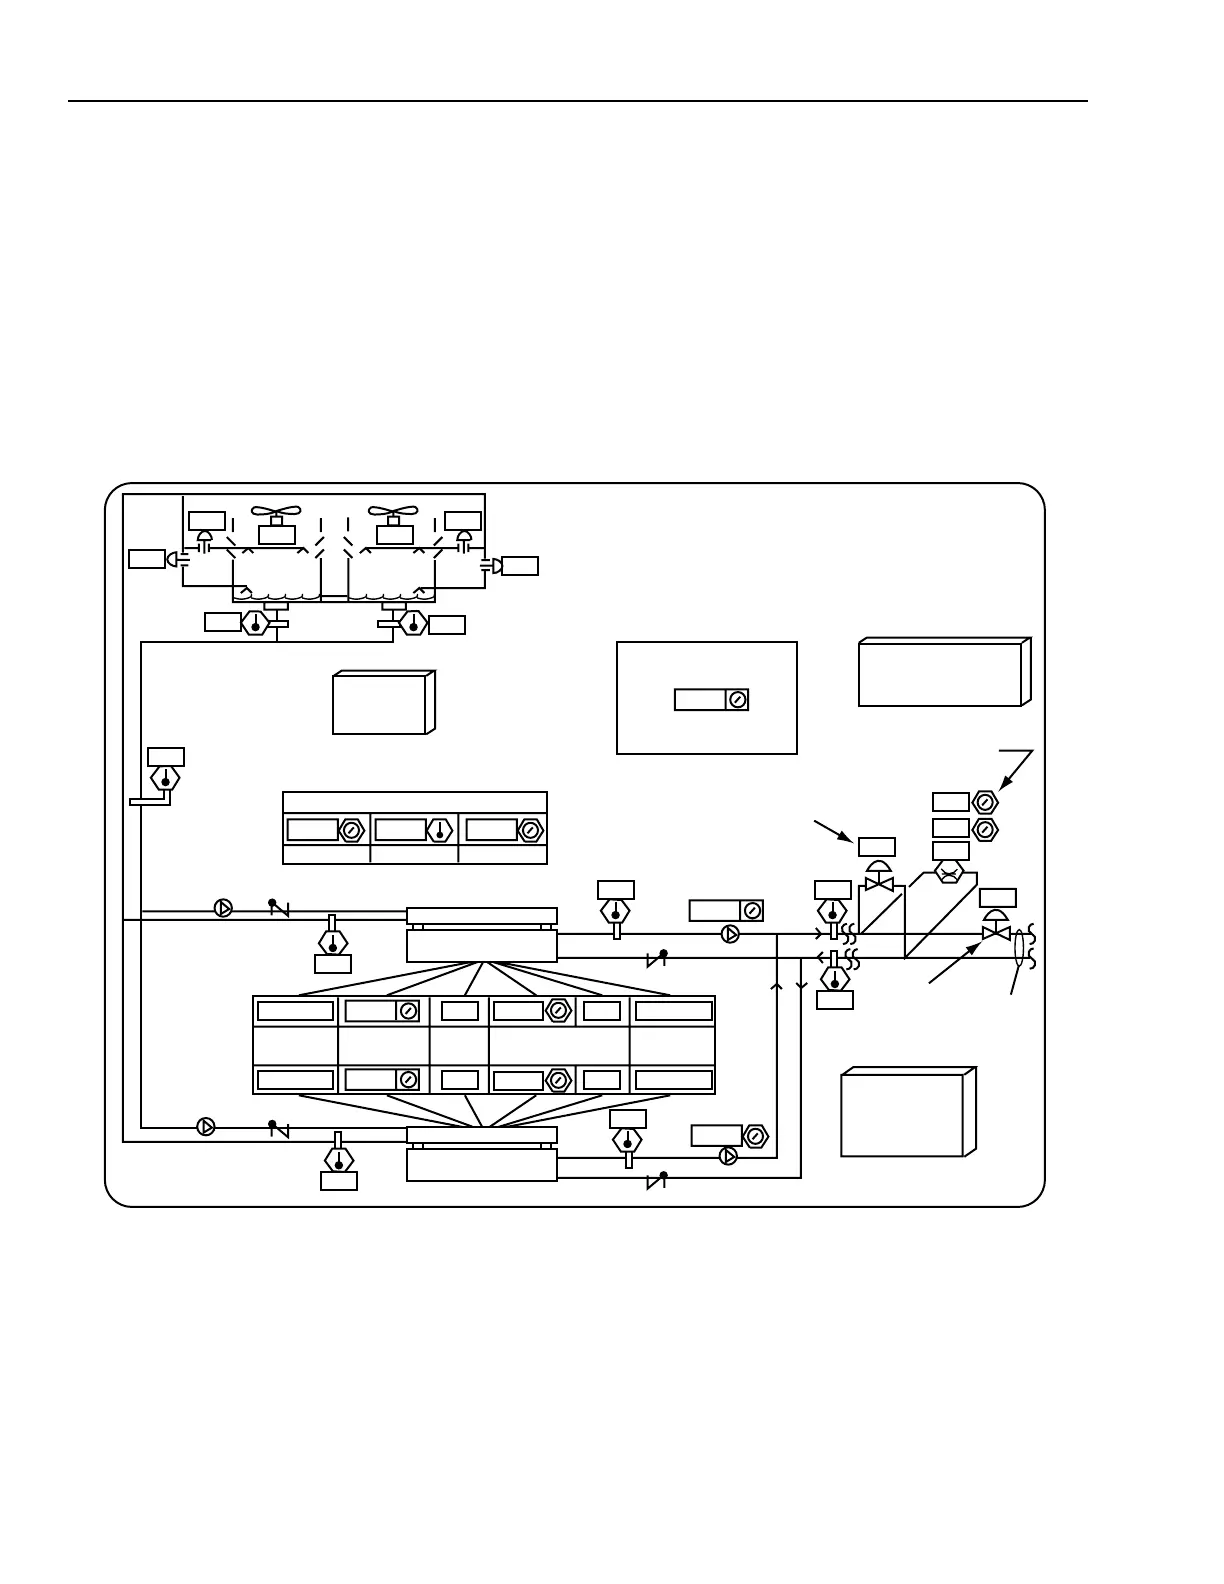
graphics should not be. Although the graphic (Fig. 7) presents
an adequate overview of the chiller plant for a building engineer,
it would be overwhelming for custodial or clerical types. They
would not understand the graphic and could cause serious
damage if they issued wrong system commands. Graphic data
compositions must consider the operators ability to understand
and need to know.
Selecting a commandable point presents analog or digital
command options to be executed via dialog boxes, radio buttons,
up-down arrows, etc. Selecting an analog input allows
modification of alarm limit values. Selecting an alarm point
allows entry and modification of the alarm message.
SPECIFYING GRAPHICS (I/O SUMMARIES)
When writing the control sequence of operation, sketch the
graphic (Fig. 7) and note the necessary inputs and outputs
required for control. Develop an Input/Output (I/O) Summary
(Fig. 8) where, the X-axis lists generic types of points and the
Y- axis lists the specific points. Publishing the graphic sketch
with all hardware and software points and symbols is an
excellent alternative to the I/O summary.
Fig. 7. Graphic Sketch for Sequence of Operation.
0
0
100
33
33
100
91
45
00
55.0
78
45.1
55
85
ON
OFF
100
100
78
NORMALENABLED
ENABLED
BY REMOTE
CONTROLS
OPERATING
MODE
ALARM
STATUS
MAX
CURRENT
STATUS
NORMAL
00
AUTO
MINIMUM
CHILLED WATER SETPOINT
MAXIMUMACTUAL
AUTO
1
AUTO
AUTO
45 46 52
100
PRESSURE
CHOKE
VALVE
CHILLER
CONTROL
SETPOINTS/
SEQUENCES
53
TO
AHUs
PSI
PRESSURE
BYPASS
VALVE
DUAL CHILLER
SETPOINT
REDUCTION
LEAD CHILLER
SELECTOR
PRESSURE BYPASS
& CHOKE VALVE
CONTROL
1 = CHILLER 1 LEADS
2 = CHILLER 2 LEADS
COOLING
TOWER
CONTROL
78
DUAL CHILLER PLANT
CONTROL
GRAPHIC DISPLAY
M15004
CHILLER 1
CHILLER 2
%
LOAD
53
78
10.5