ENGINEERING MANUAL OF AUTOMATIC CONTROL
GENERAL ENGINEERING DATA
491
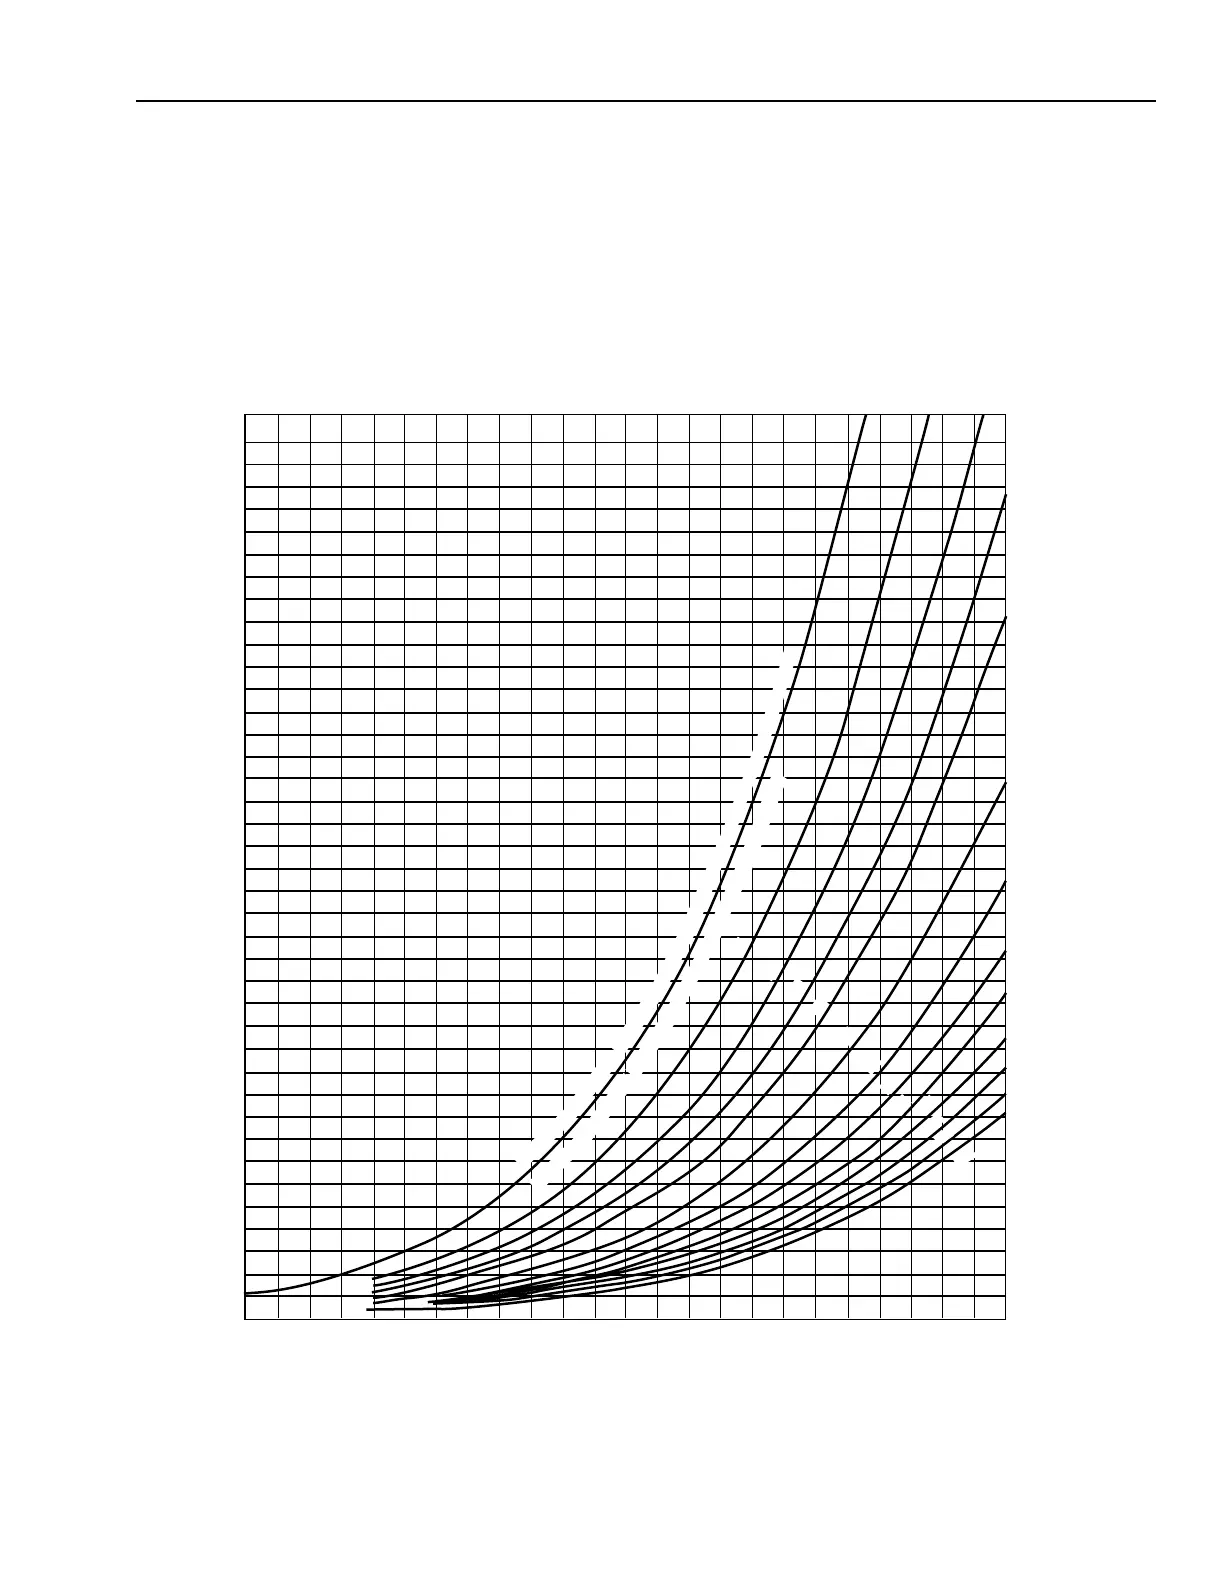
MOISTURE CONTENT OF AIR DATA
0102030405060708090100110120
COMPRESSED AIR TEMPERATURE, °F
POUNDS OF MOISTURE PER POUND OF DRY AIR
0.040
0.038
0.036
0.034
0.032
0.030
0.028
0.026
0.024
0.022
0.020
0.018
0.016
0.014
0.012
0.010
0.008
0.006
0.004
0.002
(
E
A
C
H
P
R
E
S
S
U
R
E
L
I
N
E
I
S
F
O
R
S
A
T
U
R
A
T
E
D
M
I
X
T
U
R
E
O
F
W
A
T
E
R
V
A
P
O
R
A
N
D
A
I
R
)
M
A
X
I
M
U
M
W
A
T
E
R
V
A
P
O
R
C
O
N
T
E
N
T
A
T
0
P
S
I
G
A
G
E
=
1
4
.
7
P
S
I
A
B
S
O
L
U
T
E
=
A
T
M
O
S
P
H
E
R
I
C
P
R
E
S
S
U
R
E
100
90
80
70
60
50
30
40
20
15
10
5
M10494
Fig. 7. Moisture in Compressed Air Versus Temperature and Pressure.
EXAMPLE:
Assume ambient conditions are 80F and 80 percent rh.
The air is compressed and stored in a tank at 30 psi and 90F.
Air is delivered to the controls at 20 psi.
See Psychrometric Chart Fundamentals section for use of the psychrometric chart and Psychrometric Charts No. 1 and No. 2
(77-0031 and 77-0031-A).
MOISTURE IN COMPRESSED AIR
Compressed air cannot hold as much moisture as air at atmospheric pressure. When compressed, moisture often condenses out
leaving the air saturated with moisture. Pneumatic systems require dry air to prevent problems with actuators or filters or restrictions
in controllers. Figure 7 is used to determine the maximum water vapor content of compressed air at various temperatures and
pressures.