Monitoring and Operating the Controller
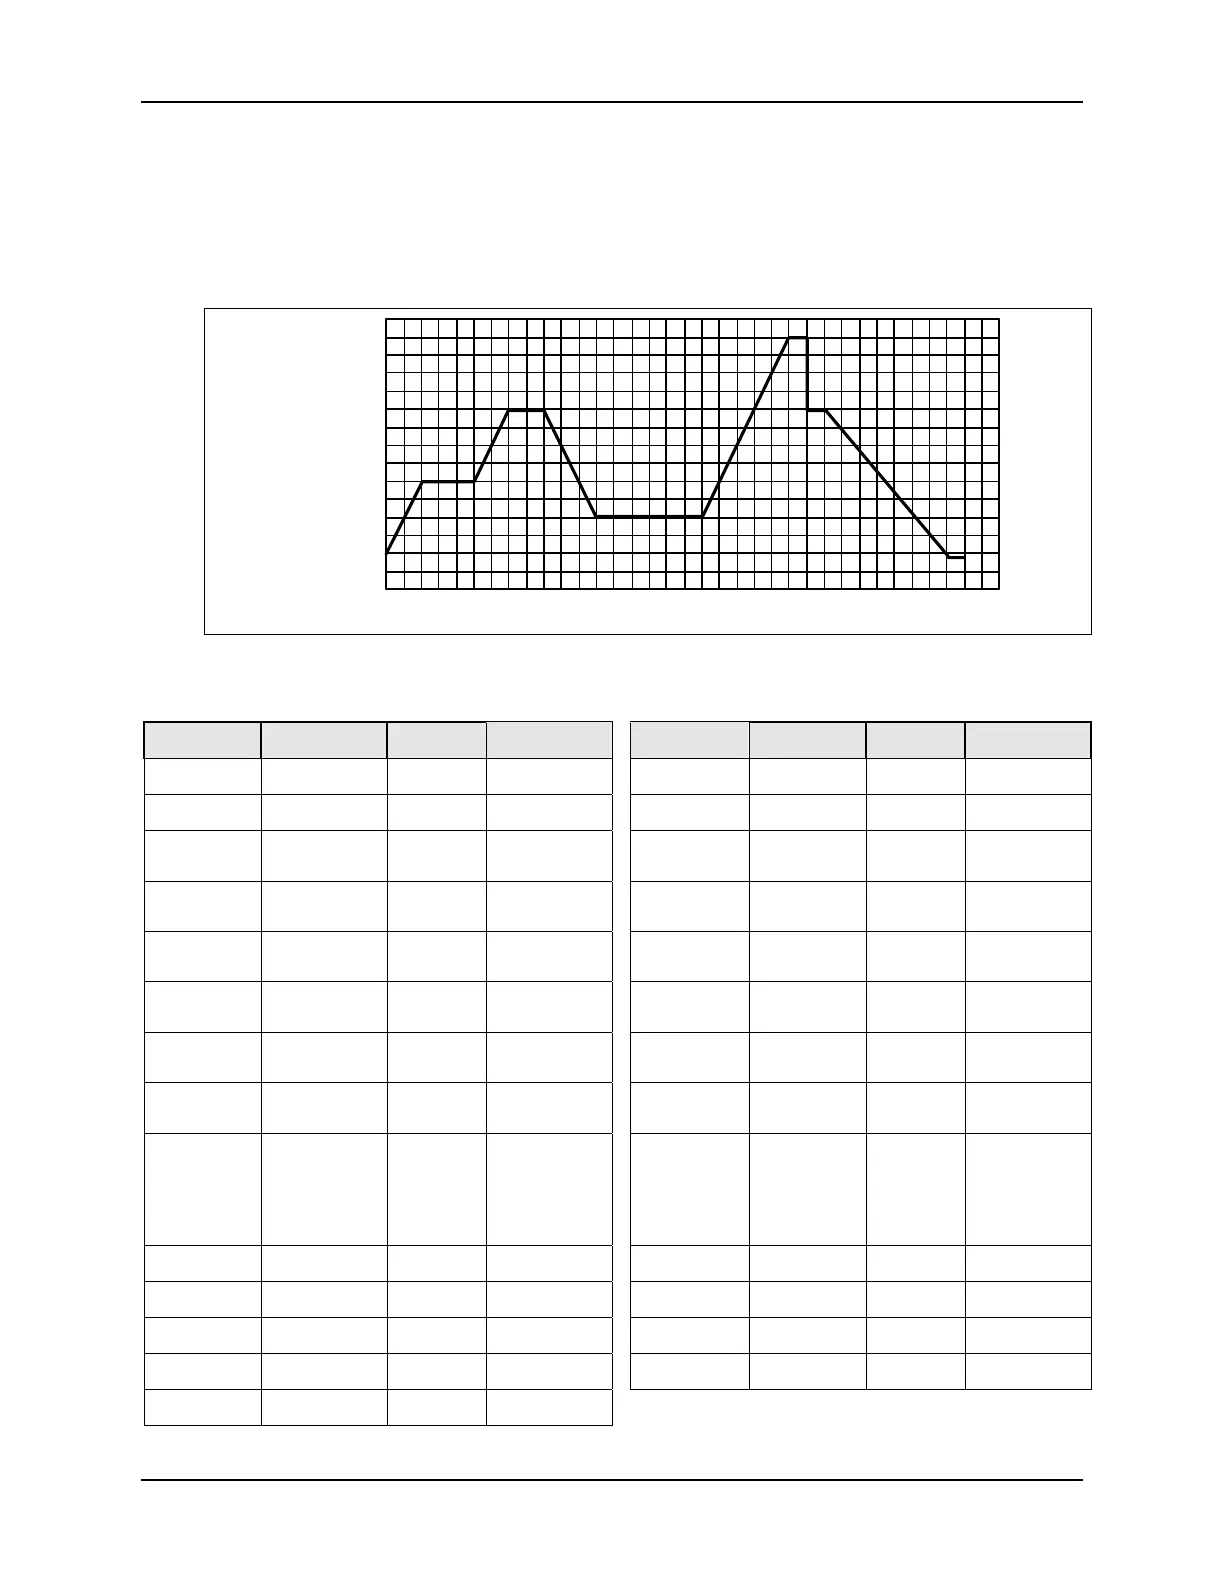
Ramp/soak profile example
Before you perform the actual configuration, we recommend that you draw a Ramp/Soak
profile in the space provided on the “Program Record Sheet” (Figure 4-4) and fill in the
associated information. An example of a Ramp-Soak Profile is shown in Figure 4-3.
Start setpoint is at 200 degrees F.
500
400
200
300
°
F
Time/Hours
0 1 2 3 4 5 6 7 8 9 10 11 12 13 14 15 16 17
SEG 2
SEG 3
SEG 4
SEG 5
SEG 6
SEG 7
SEG 8
SEG 9
SG 10
SG 11
SG 12
SEG 1
F
20765
Setpoint
Figure 4-3 Ramp/Soak Profile Example
Ramp/Soak Profile Example
Prompt Function Segment Value Prompt Function Segment Value
STRT SEG
Start Seg. 1
SEG4TIME
Soak Time 4 1 hr.
END SEG
End Seg. 12
SEG5RAMP
Ramp Time 5 1 hr:30 min.
RAMP UNIT
Engr. Unit for
Ramp
TIME
SEG6 SP
Soak SP 6 250
RECYCLES
Number of
Recycles
2
SEG6TIME
Soak Time 6 3 hr:0 min.
SOAK DEV
Deviation
Value
0
SEG7RAMP
Ramp Time 7 2 hr:30 min.
PROG END
Controller
Status
LAST SP
SEG8 SP
Soak SP 8 500
STATE
Controller
State at end
HOLD
SEG8TIME
Soak Time 8 0 hr:30 min.
KEYRESET
Reset SP
Program
DISABLE
SEG9RAMP
Ramp Time 9 0
HOTSTART
PV Hot Start
Program
Initialization
or power up
in SPP
DISABLE
SG10 SP
Soak SP 10 400
SEG1RAMP
Ramp Time 1 1 hr.
SG10 TIME
Soak Time 10 0 hr:30 min.
SEG2 SP
Soak SP 2 300
SG11RAMP
Ramp Time 11 3 hr:30 min.
SEG2TIME
Soak Time 2 1 hr:30 min.
SG12 SP
Soak SP 12 200
SEG3RAMP
Ramp Time 3 1 hr.
SG12TIME
Soak Time 12 0 hr:30 min.
SEG4 SP
Soak SP 4 400
128 UDC3200 Universal Digital Controller Product Manual 12/04
 Loading...