Keysight N9927-90001 User’s Guide 245
RTSA (Real-Time Spectrum Analyzer) Mode—Option 350 (CPU2 Only)
Spectrogram Display
Spectrogram Display
Spectrogram display provides a visual history of the measured spectrum. This
display type can be used to locate intermittent signals or to view signal levels
and frequencies over time.
This display can NOT be used with Channel Measurements.
Spectrogram Display (RTSA Option)
Spectrogram draws the most recent trace record at the bottom of the stack of
previously-drawn trace records. Drawing the live trace on the display is
optional.
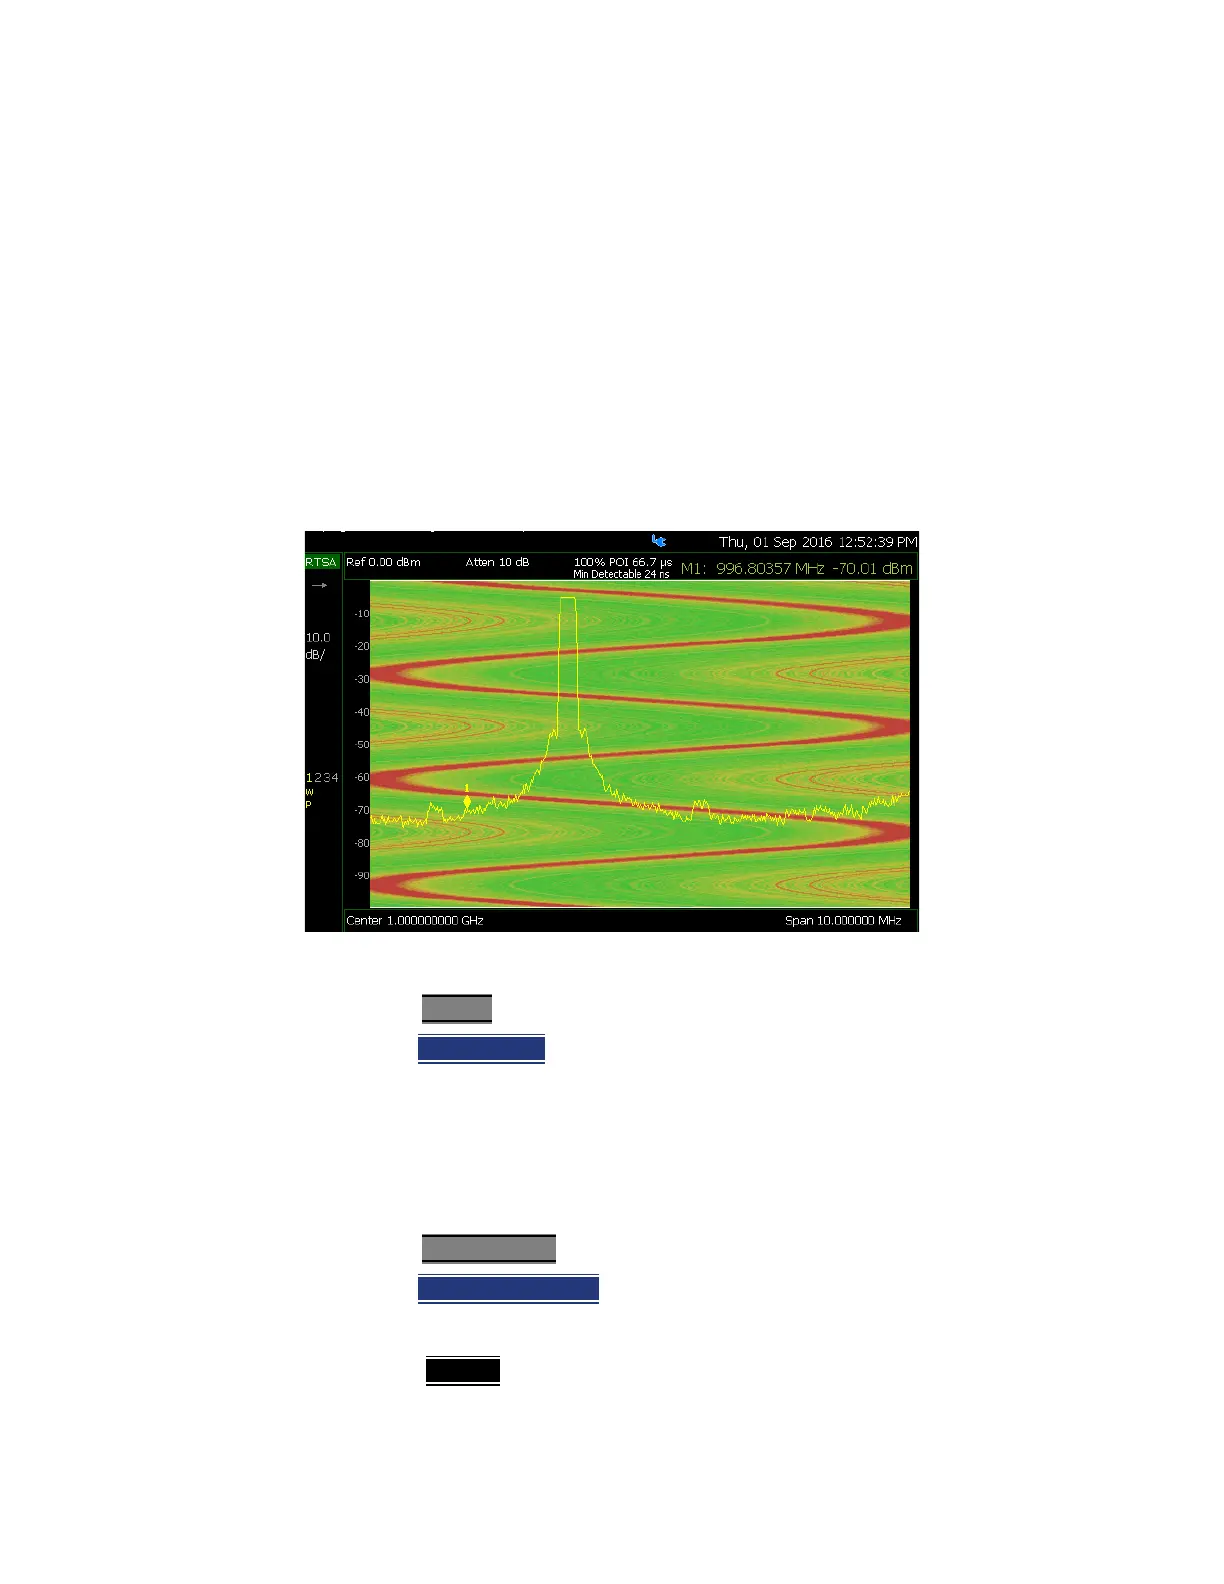
Figure 10-6 Spectrogram display- Overlay view
How to select Spectrogram
—Press Meas 1
—Then Spectrogram
How to modify the Spectrogram
You can change how the spectrogram is displayed relative to the data trace.
This setting affects the total number of trace records that can be displayed.
For RTSA Mode:
—Press Meas Setup 4.
—Then Spectrogram View
— Then choose from the following:
— Overlay
Displays the data trace over the spectrogram with NO
graticules. Total trace records: 340.
 Loading...