MI 2893 / MI 2892 / MI 2885 Under deviation and over deviation
69
Maximal ( ), average ( ) and minimal ( ) temperature value for last recorded
time interval (IP)
Table 44: Keys in Temperature trend screens
Shows temperature in Celsius degrees.
Shows temperature in Fahrenheit degrees.
Switches to TREND view (available only during recording).
Returns to the “MEASUREMENTS” submenu.
3.12 Under deviation and over deviation
Under deviation and over deviation parameters are useful when it is important to avoid, for example,
having sustained under voltages being cancelled in data by sustained over voltages. Results can be seen
in a tabular (METER) or a graphical form (TREND) view - which is active only while GENERAL RECORDER
is active. See section 3.14 for instructions how to start recording. In order to understand meanings of
particular parameter see section 5.1.12.
3.12.1 Meter
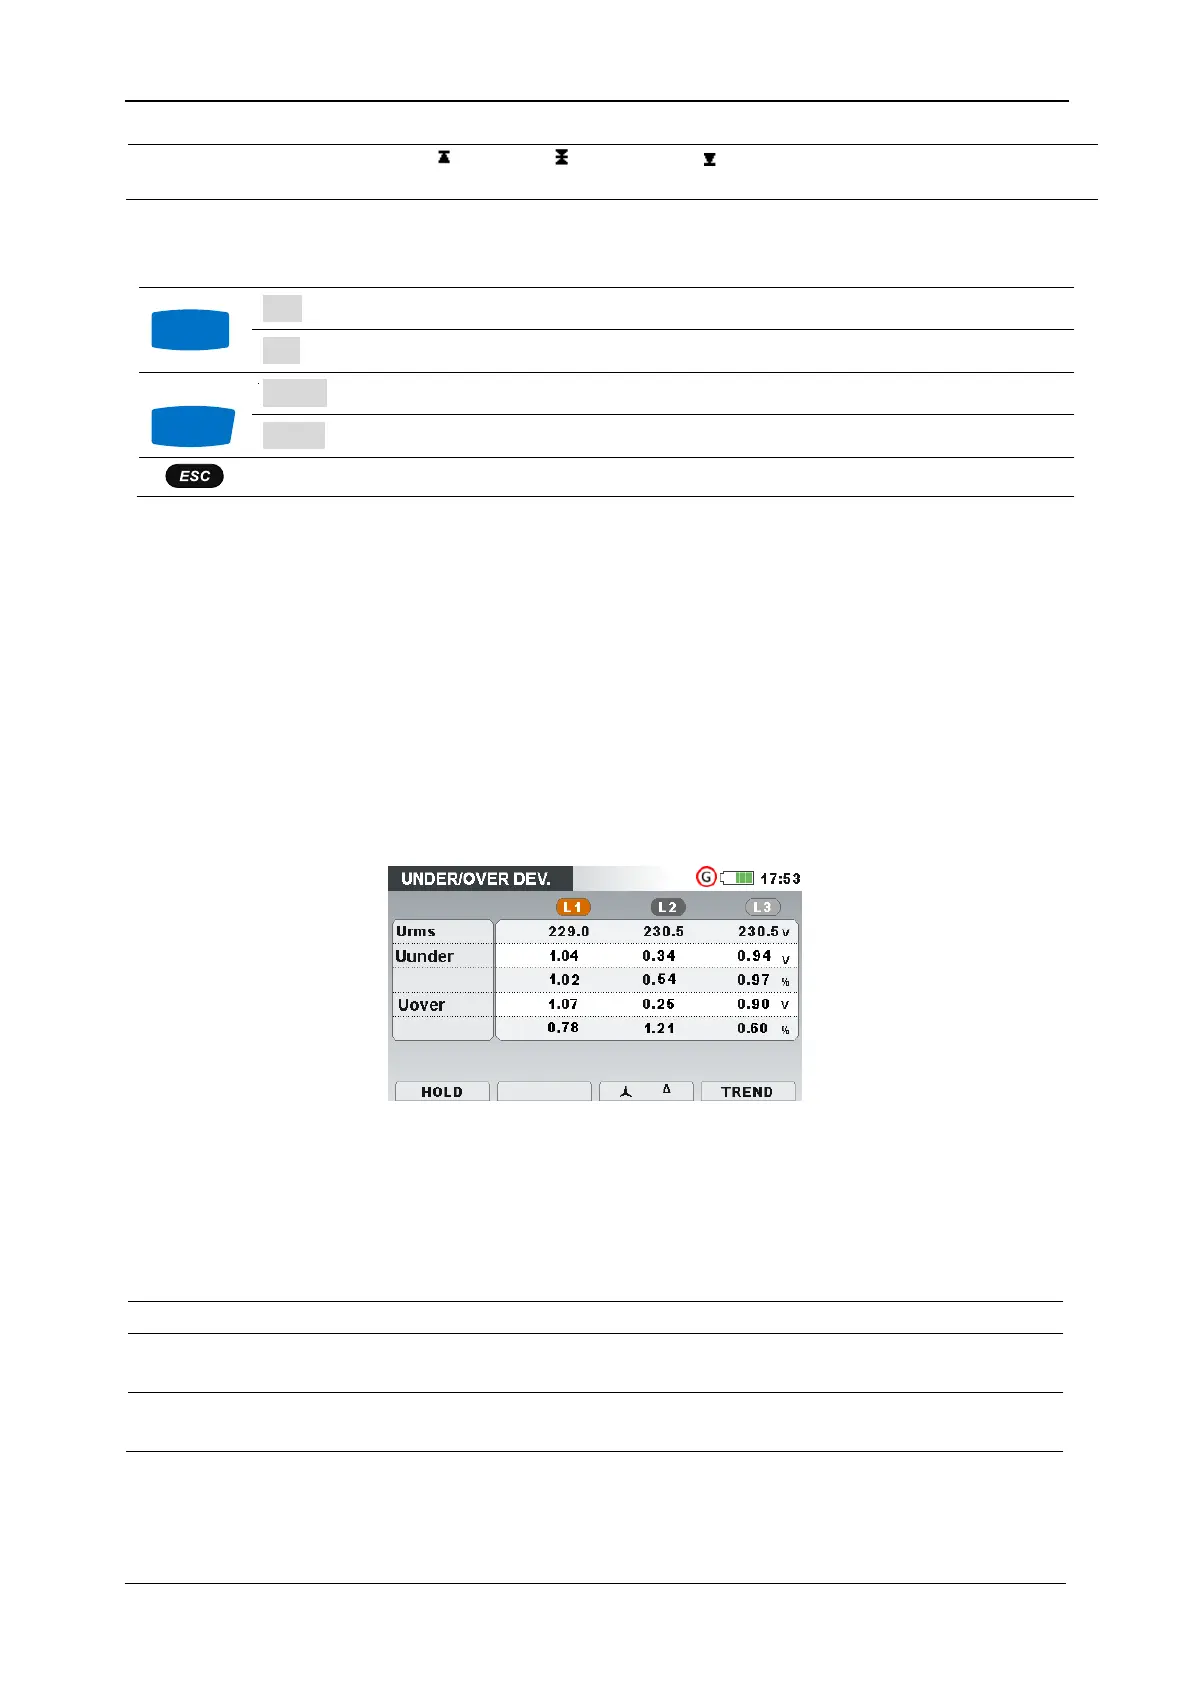
By entering DEVIATION option from MEASUREMENTS submenu, the UNDER/OVER DEVIATION tabular
screen is shown (see figure below).
Figure 51: Under deviation and over deviation table screen
Description of symbols and abbreviations used in METER screen is shown in table below.
Table 45: Instrument screen symbols and abbreviations
True effective value U
1
, U
2
, U
3
, U
12
, U
23
, U
31
Instantaneous under deviation voltage U
Under
expressed in voltage and % of nominal
voltage
Instantaneous over deviation voltage U
Over
expressed in voltage and % of nominal
voltage
Table 46: Keys in Under deviation and over deviation (METER) screen
 Loading...