MI 2893 / MI 2892 / MI 2885 Signalling
72
True effective value signal voltage (U
Sig1
, U
Sig2
, U
Sig3
, U
Sig12
, U
Sig23
, U
Sig31
) for a user-
specified carrier frequency (316.0 Hz in shown example) expressed in Volts or
percent of fundamental voltage
True effective value signal voltage (U
Sig1
, U
Sig2
, U
Sig3
, U
Sig12
, U
Sig23
, U
Sig31
) for a user-
specified carrier frequency (1060.0 Hz in shown example) expressed in Volts or
percent of fundamental voltage
True effective value of phase or phase to phase voltage U
Rms
(U
1
, U
2
, U
3
, U
12
, U
23
,
U
31
)
Table 50: Keys in Signalling (METER) screen
Holds measurement on display. Hold clock time will be displayed in the
right top corner.
Switches to TREND view (available only during recording).
Switches to TABLE view (available only during recording).
Triggers Waveform snapshot.
Returns to the “MEASUREMENTS” submenu.
3.13.2 Trend
During active recording TREND view is available (see section 3.14 for instructions how to start
recording). Signalling parameters can be observed by cycling function key F4 (METER -TREND).
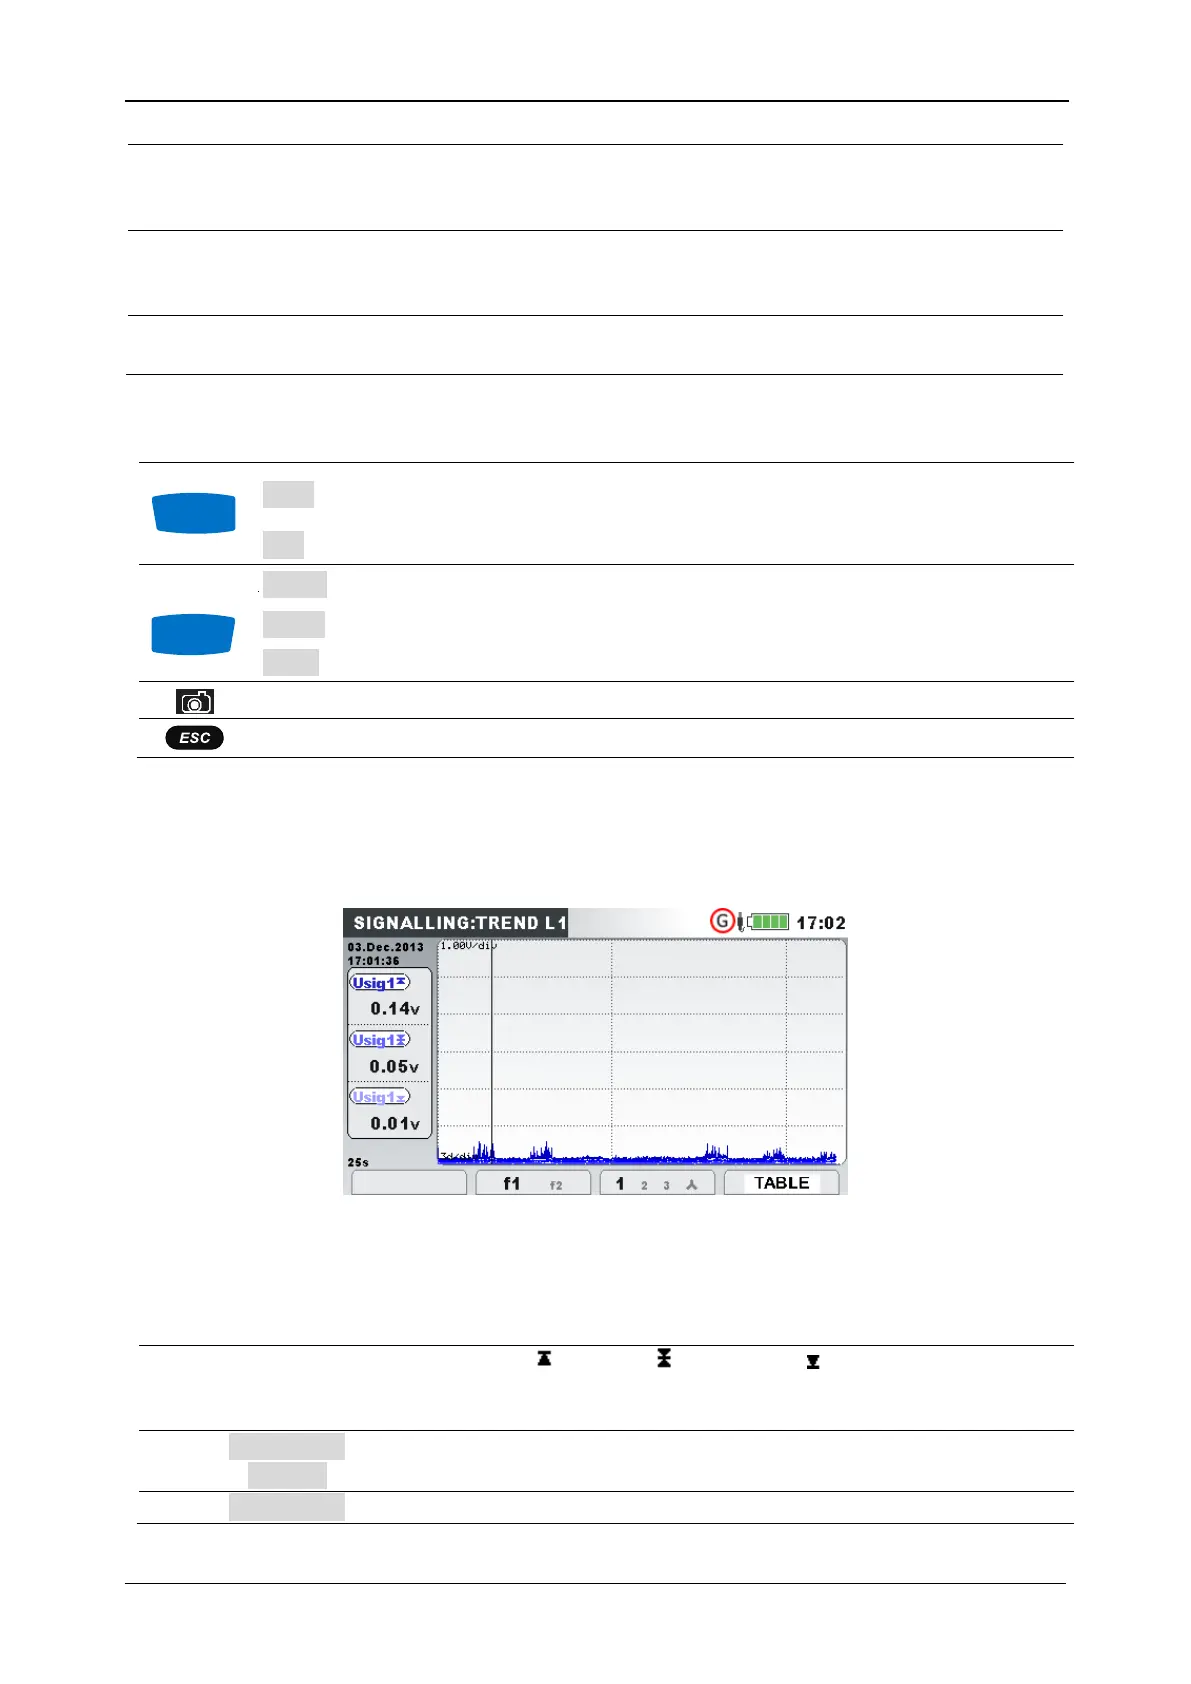
Figure 54: Signalling trend screen
Table 51: Instrument screen symbols and abbreviations
Usig1, Usig2, Usig3,
Usig12, Usig23, Usig31
Maximal ( ), average ( ) and minimal ( ) value of (U
Sig1
, U
Sig2
, U
Sig3
,
U
Sig12
, U
Sig23
, U
Sig31
) signal voltage for a user-specified Sig1/Sig2
frequency (Sig1 = 316.0 Hz / Sig2 = 1060.0 Hz in shown example).
Timestamp of interval (IP) selected by cursor.
Current GENERAL RECORDER time (Days hours: min: sec)
Table 52: Keys in Signalling (TREND) screen