MI 2893 / MI 2892 / MI 2885 Flickers
62
3.9 Flickers
Flickers measure the human perception of the effect of amplitude modulation on the mains voltage
powering a light bulb. In Flickers menu instrument shows measured flicker parameters. Results can be
seen in a tabular (METER) or a graphical form (TREND) - which is active only while GENERAL RECORDER
is active. See section 3.14 for instructions how to start recording. In order to understand meanings of
particular parameter see section 5.1.9.
3.9.1 Meter
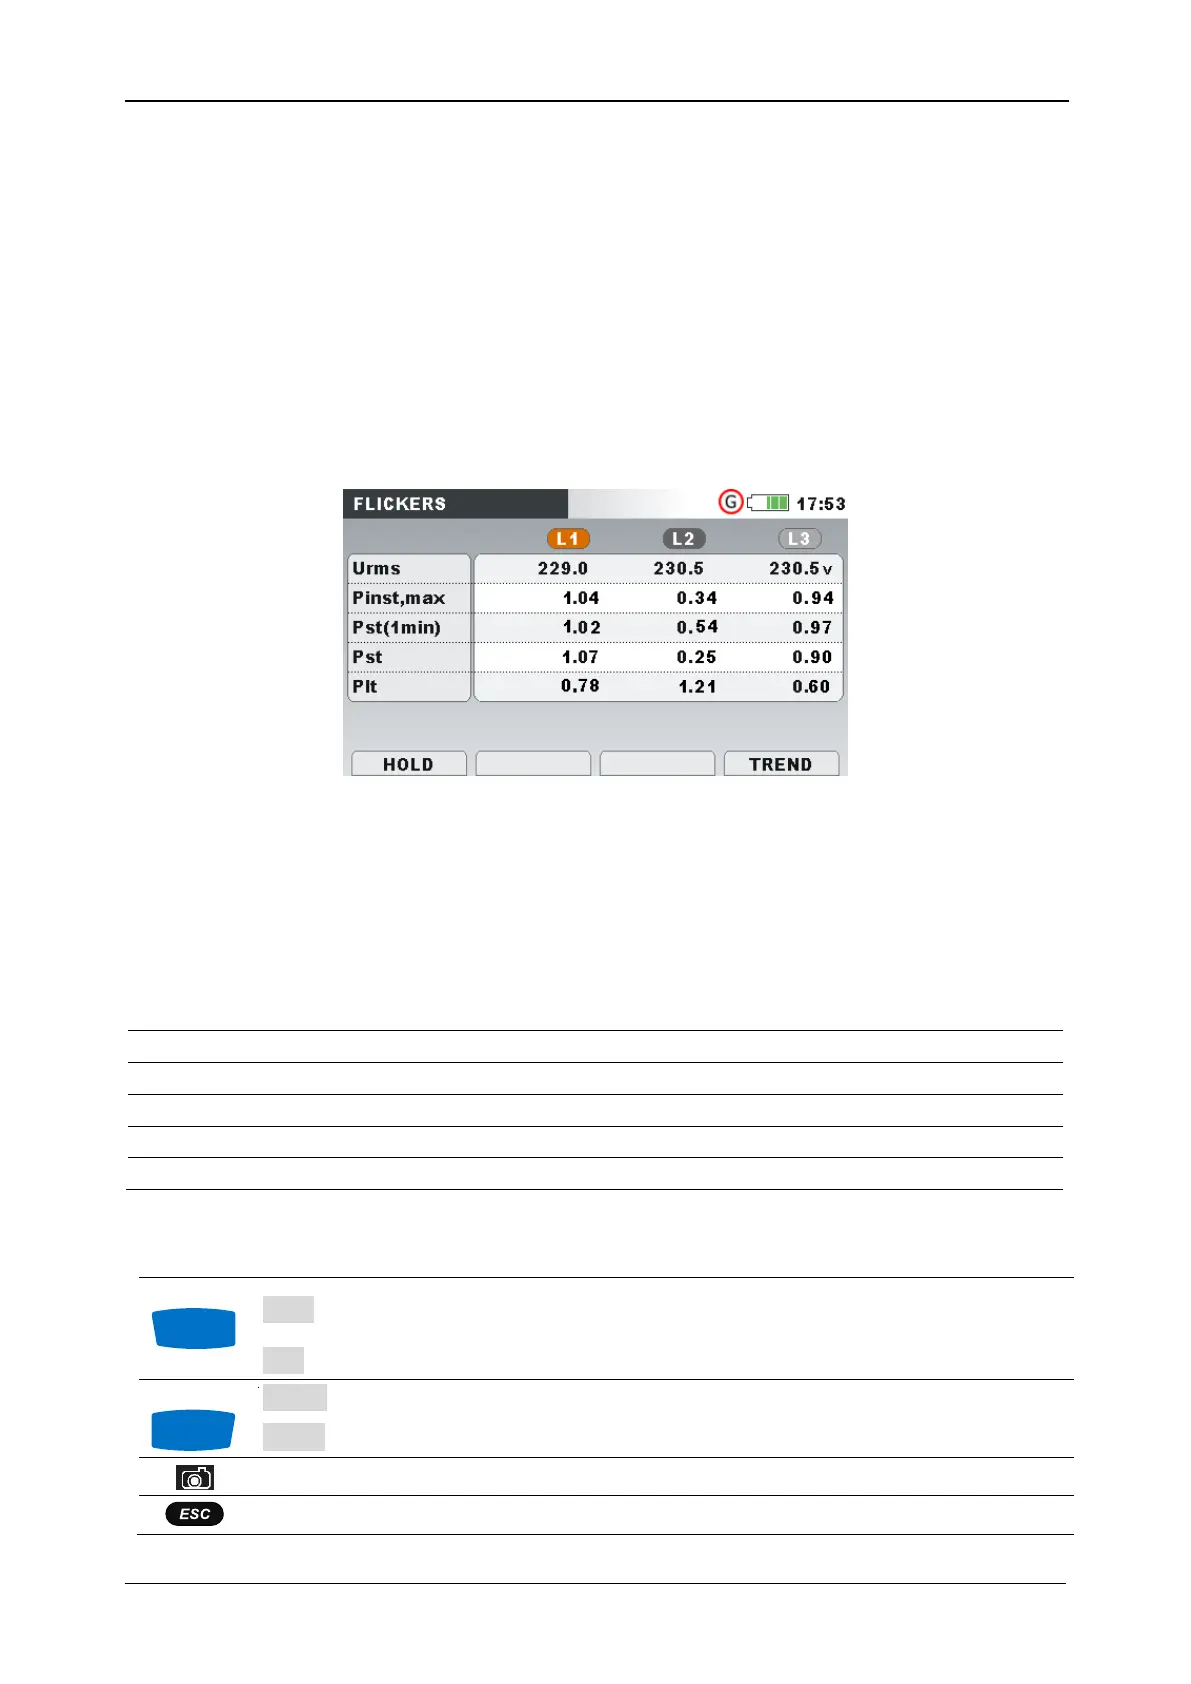
By entering FLICKERS option from MEASUREMENTS submenu, the FLICKERS tabular screen is shown (see
figure below).
Figure 44: Flickers table screen
Description of symbols and abbreviations used in METER screen is shown in table below. Note that
Flickers measurement intervals are synchronised to real time clock, and therefore refreshed on minute,
10 minutes and 2 hours intervals.
Table 31: Instrument screen symbols and abbreviations
True effective value U
1
, U
2
, U
3
, U
12
, U
23
, U
31
Maximal instantaneous flicker for each phase refreshed each 10 seconds
Short term (1 min) flicker P
st1min
for each phase measured in last minute
Short term (10 min) flicker P
st
for each phase measured in last 10 minutes
Long term flicker (2h) P
st
for each phase measured in last 2 hours
Table 32: Keys in Flickers (METER) screen
Holds measurement on display. Hold clock time will be displayed in the
right top corner.
Switches to TREND view (available only during recording).
Triggers Waveform snapshot.
Returns to the “MEASUREMENTS” submenu.
 Loading...