Statistics 13 - 137
10.Refer to the Temperature Trend Over Last Day graph to assess whether deployment area temperature is consistent
across specific hours of the day. Use this information to help determine whether the AP8132 can be upgraded or powered
off during specific hours of the day.
11. Select the Motion tab.
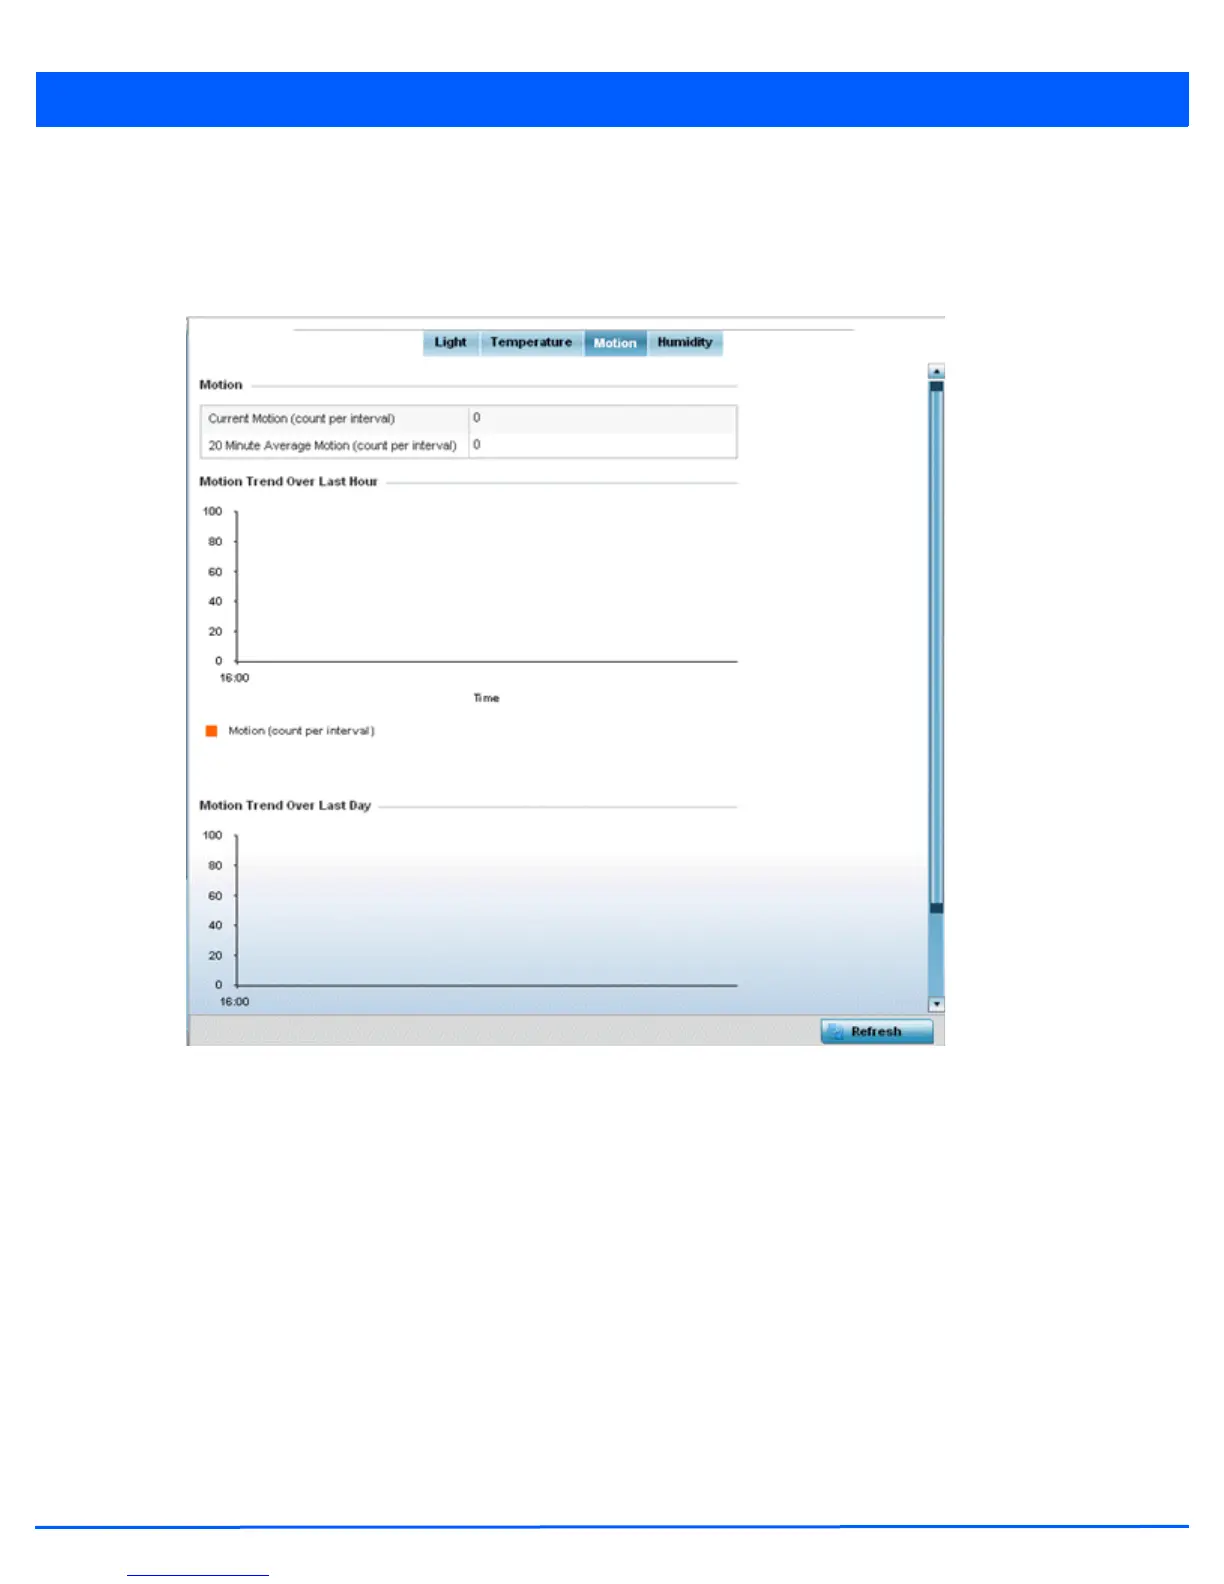
Figure 13-93 Access Point - Environmental Sensor screen (Motion tab)
12.Refer to the Motion table to assess the sensor's detected movement within the AP8132’s immediate deployment area.
Motion is measured in intervals. The table displays the Current Motion (count per interval) and a 20 Minute Average
Motion (count per interval). Compare these two items to determine whether the AP8132’s deployment location remains
consistently occupied by client users. For more information on enabling the sensor, see Environmental Sensor Configuration
on page 5-171.
13.Refer to the Motion Trend Over Last Hour graph to assess the fluctuation in user movement over the last hour. Use this
graph in combination with the Light and Temperature graphs (in particular) to assess the deployment area’s activity level.
14.Refer to the Motion Trend Over Last Day graph to assess whether deployment area user movement is consistent across
specific hours of the day. Use this information to help determine whether the AP8132 can be upgraded or powered off
during specific hours of the day.
15. Select the Humidity tab.
 Loading...