13 - 138 WiNG 5.5 Access Point System Reference Guide
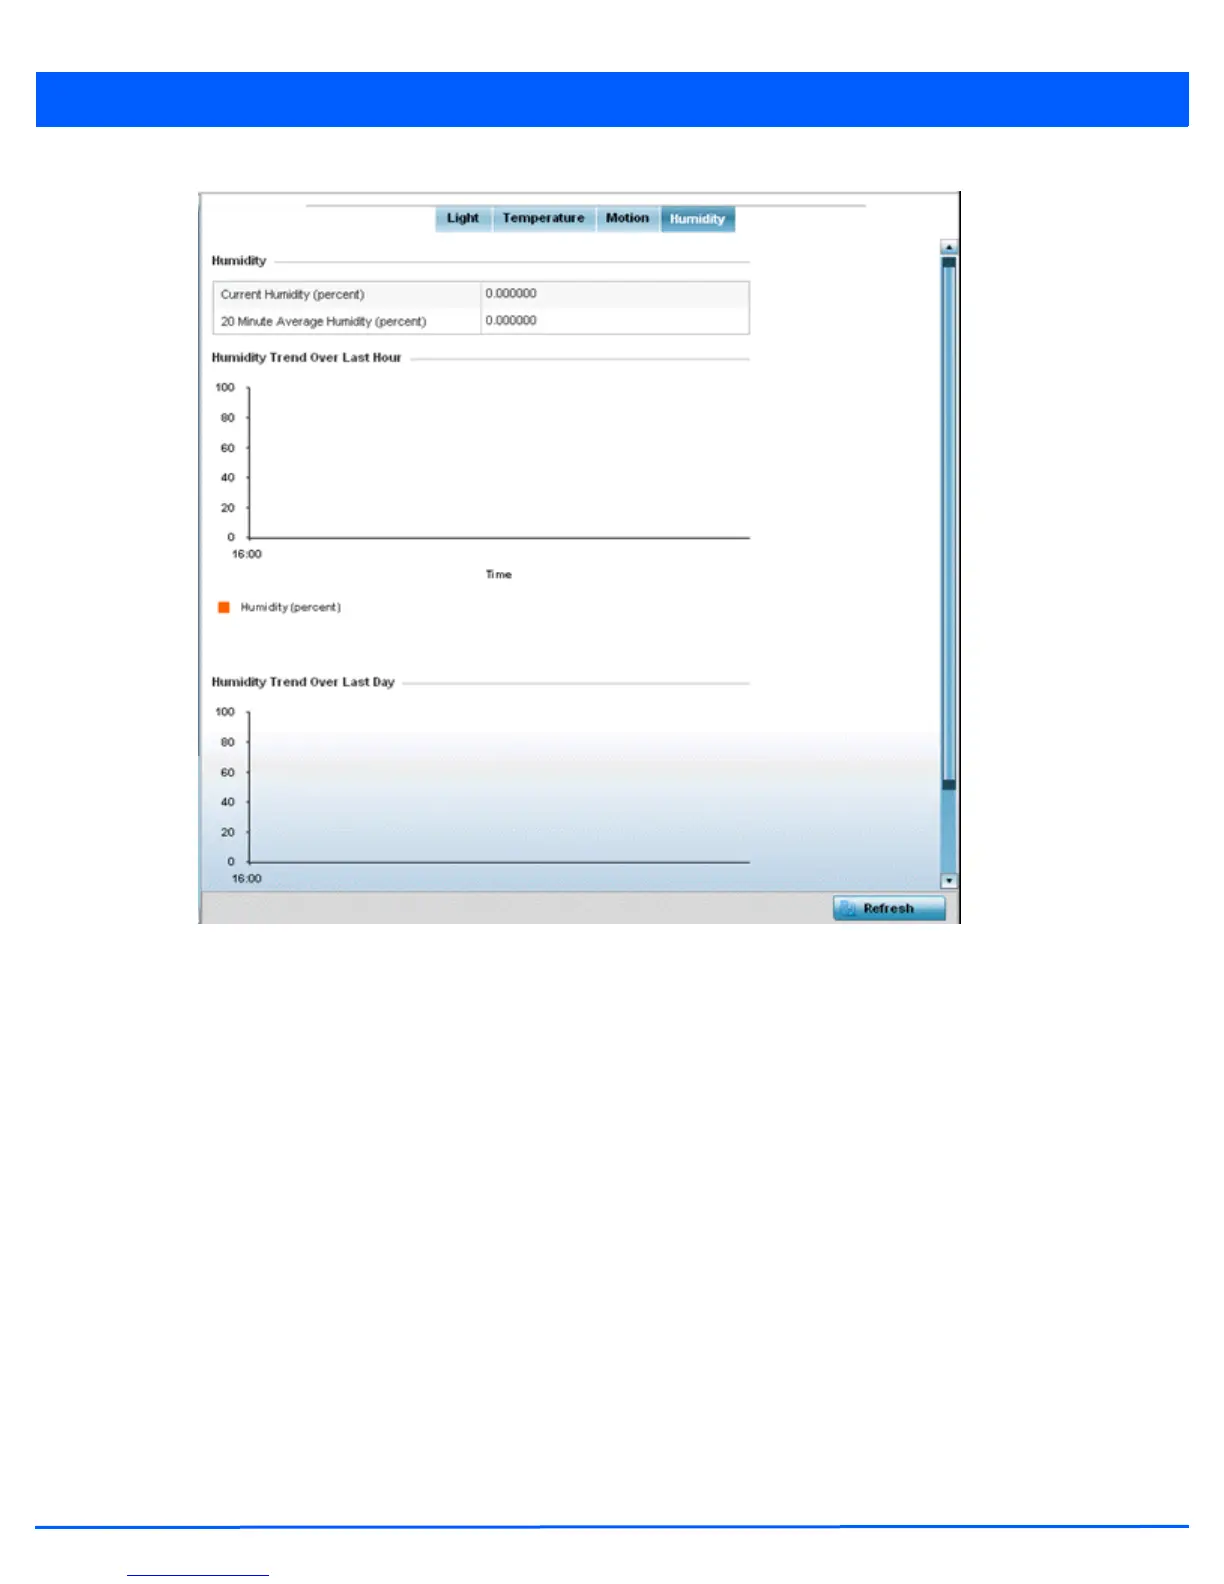
Figure 13-94 Access Point - Environmental Sensor screen (Humidity tab)
16.Refer to the Humidity table to assess the sensor's detected humidity fluctuations within the AP8132’s immediate
deployment area.
Humidity is measured in percentage. The table displays the Current Humidity (percent) and a 20 Minute Average
Humidity (percent). Compare these two items to determine whether the AP8132’s deployment location remains
consistently humid (often a by-product of temperature). For more information on enabling the sensor, see Environmental
Sensor Configuration on page 5-171.
17.Refer to the Humidity Trend Over Last Hour graph to assess the fluctuation in humidity over the last hour. Use this graph
in combination with the Temperature and Motions graphs (in particular) to assess the deployment area’s activity levels.
18.Refer to the Humidity Trend Over Last Day graph to assess whether deployment area humidity is consistent across
specific hours of the day. Use this information to help determine whether the AP8132 can be upgraded or powered off
during specific hours of the day.
 Loading...