7 Functions and settings
© Maschinenfabrik Reinhausen 2012 2117246/02 EN TAPCON® 230 basic 85
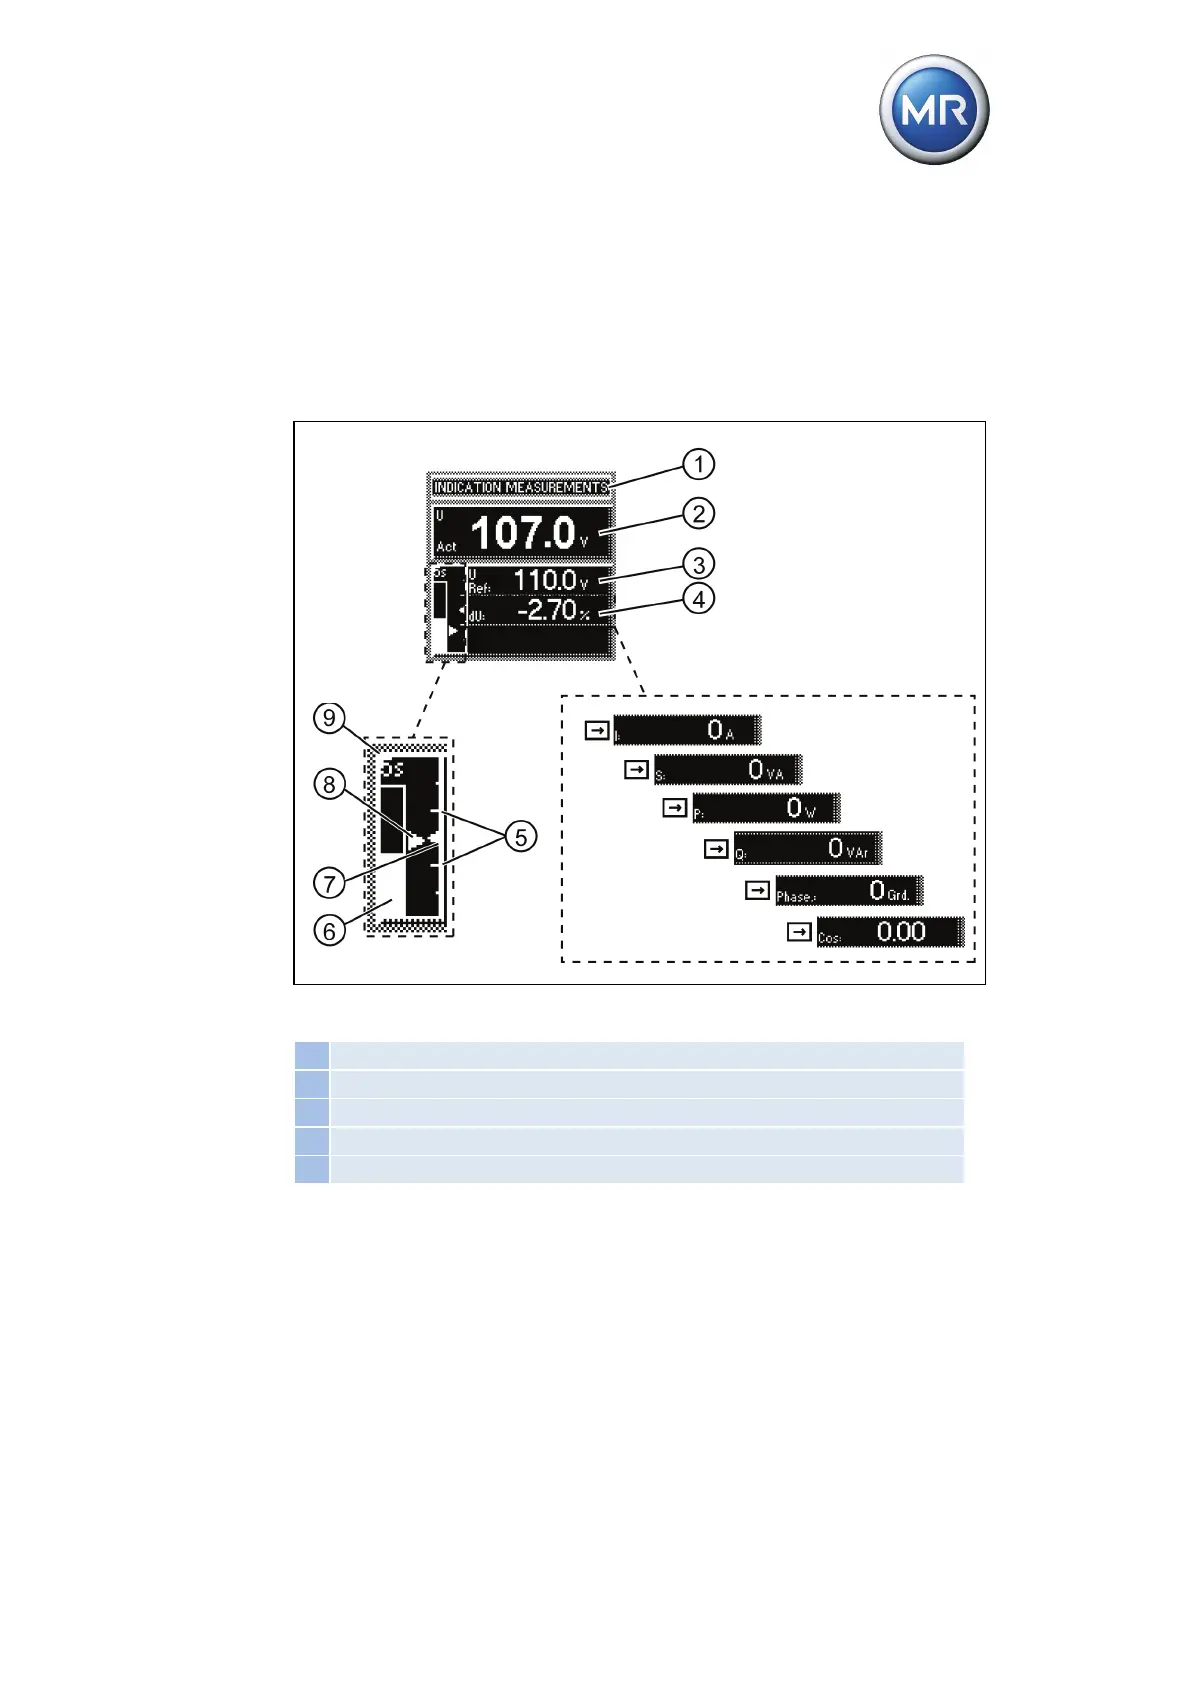
7.3.7.1 Visual display
The deviation from the set bandwidth is shown visually in the device display.
The measured voltage mark (V
actual
) shows whether the measured voltage is
above, within or below the set bandwidth. Progress of delay time T1 is indi-
cated by the gradual filling of the time bar in the device display. The seconds
display above this indicates the remaining delay time T1.
Figure 28 Visual display of deviation from desired value
1 Bandwidth (upper and lower limit)
2 Time bar for delay time T1
3 Desired voltage value
4 Measured voltage (V
actual
)
5 Remaining delay time T1