6 Operating modes EFA-200/-300
6-18
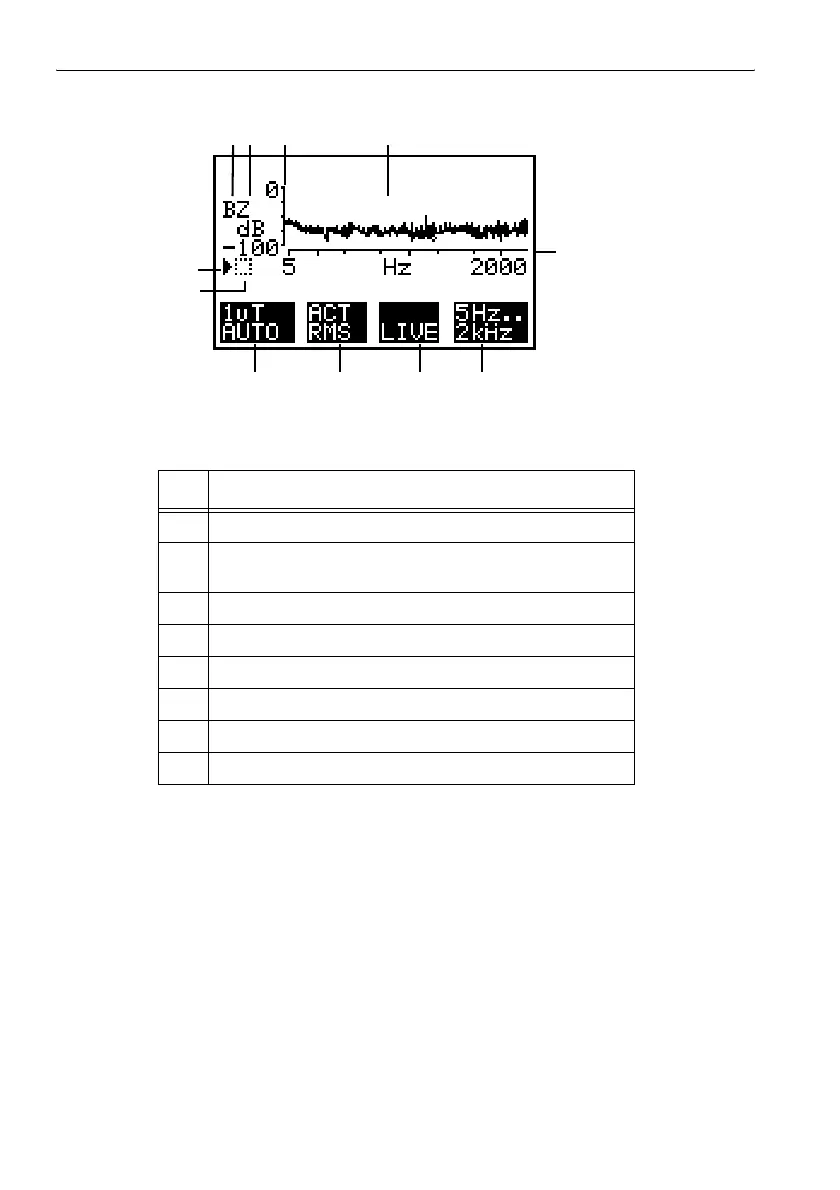
Figure 6-8 Display elements of the measurement screen for Spectrum FFT mode
No. Function
1 Field quantity, here the B field
2 Measurement axis, here the Z axis
without footnote: ISOTROPIC
3 Measured value axis
4 Graphical display of the measured values
5 Frequency axis
6 Display field F4: Display of the selected frequency range
7 Display field F3: Display of the selected display mode
8 Display field F2: Display of the selected detection mode
Table 6-5 Screen evaluation for Spectrum FFT mode
1
34
11
987
6
5
2
10