6 Measurements with the NBM-550 and EHP-50
70 NBM-550 Narda
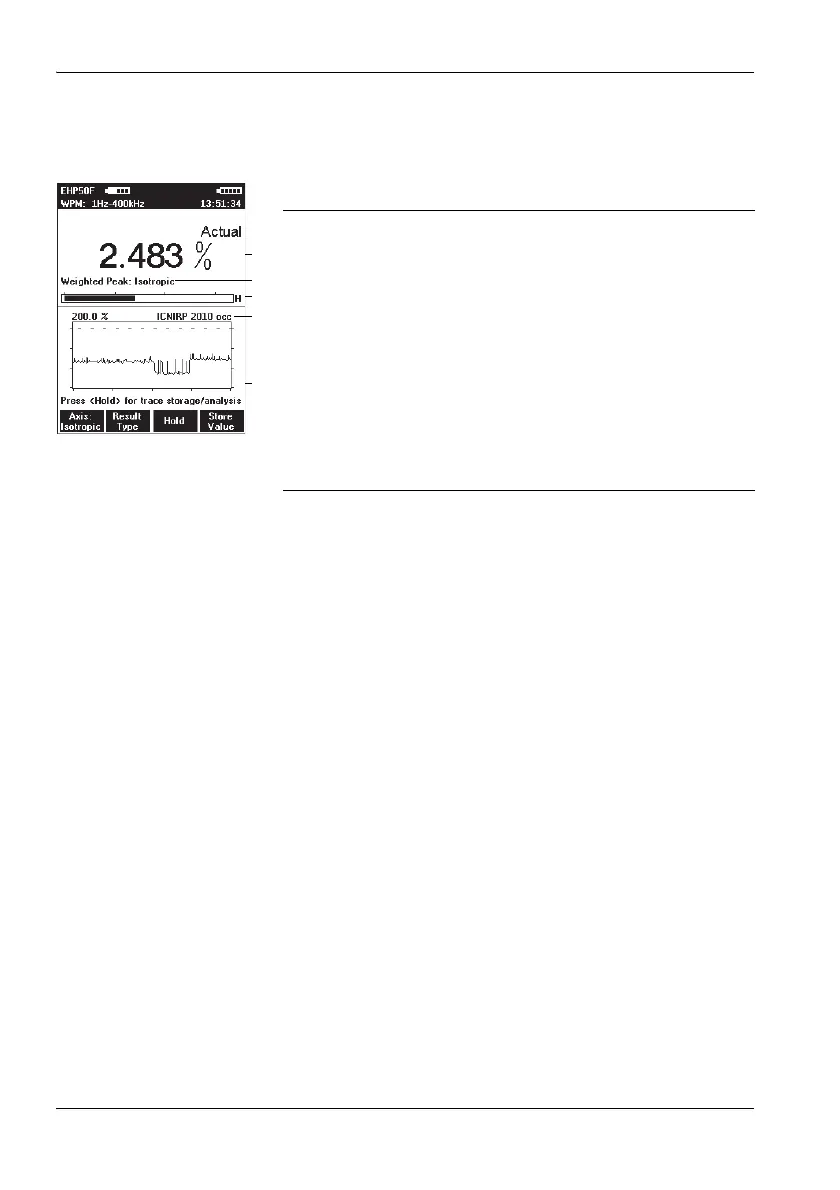
WPM display mode displays the percentage of the limit
value that has been reached referred to the selected safety
standard (wideband value from 1 Hz to 400 kHz) and a
graph of the field strength value versus time.
To change the time scale:
1. Open the History Time Scale function
(MAIN MENU/DATA LOGGER/...)
2. Use the arrow keys ▲/▼ to select the desired time and
press the OK key to confirm the setting.
Taking measurements from the graph
1. Press the Hold key to freeze the display.
Hold is shown in the display, but measurements con-
tinue to be made in the background.
2. Press the Marker ON function key to dispplay the cursor.
Further items are now shown in the display:
– Crosshairs: For selecting a measurement point
– WPM: Maximum value at the cursor position
– Time: Time the measurement at the cursor position
was made
3. Use the / function keys to shift the cursor to the left or
right, or press the Highest value function key to move
the marker to the highest value.
4. Press the Marker OFF function key to remove the cursor
from the display.
5. Press the Continue function key to unfreeze the display.
The recorded measured values and the graph will be
updated from the time that the Hold key was pressed.
1 Result type and numerical display of the percentage
of the limit value reached for the selected standard
2 Display of the currently selected sensor axis:
Isotropic, X, Y, or Z
3 Graphical display of weighted field strength with
indication of selected field type (H-field in the
example)
4 Display of selected evaluation standard
5 Graph of measured value versus time. The measured
value axis is logarithmic and is fixed, depending on
the field type and measurement range selected. The
time axis setting is variable