6.5 Spectrum display mode
Narda NBM-550 71
Meaning of the WPM values
Measurement values are captured continuously while the
graph is drawn. However, the graph display can only use
discrete time points that can be selected using the cursor.
The maximum value measured within the corresponding
time window (interval) between time points is shown for
each time point. The trace memory can display a maximum
of 200 measurement intervals.
Saving the measurement values recorded
You can save the measurement values in the trace memory.
To save the measured value recording:
1. Press the Hold key to freeze the display.
2. Press the Save History function key.
The measured value recording is saved. You can add
a voice comment if you have activated this function.
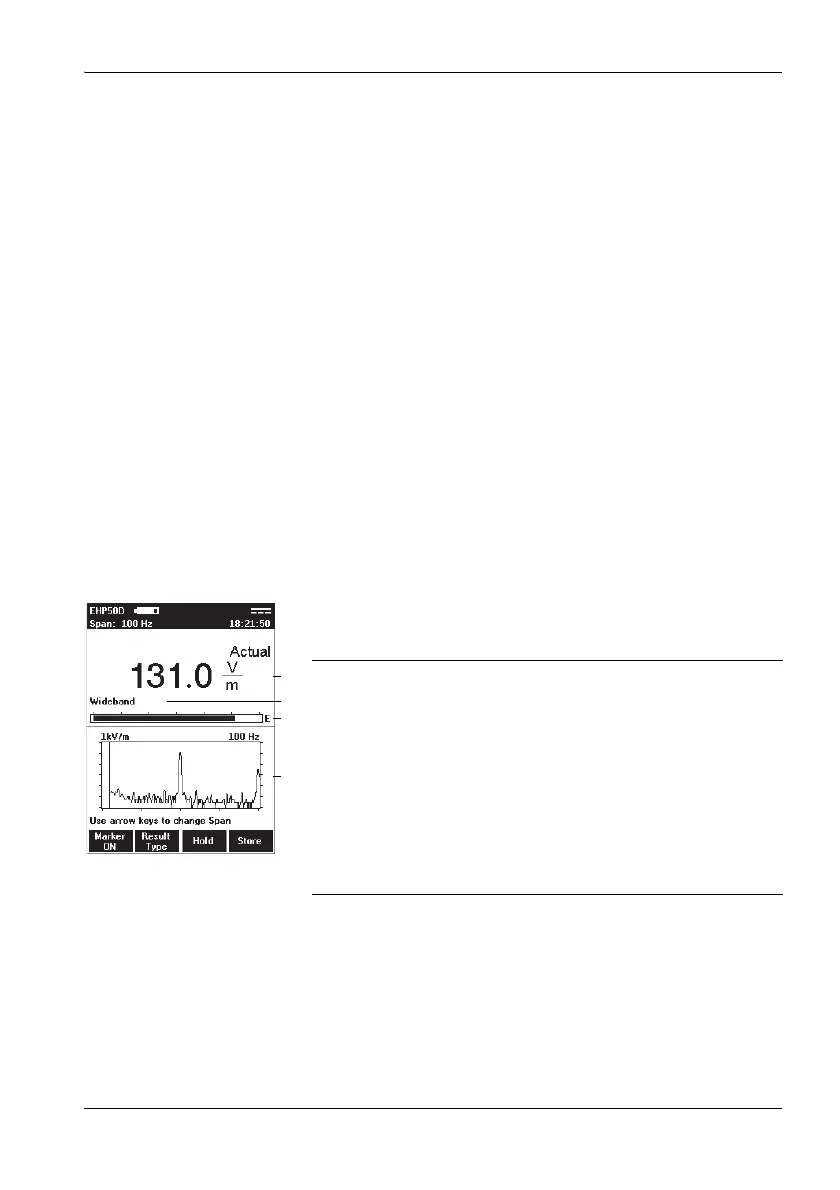
6.5 Spectrum display mode
Spectrum display mode displays the field strength versus
frequency values graphically and numerically.
1 Result type and numerical display of field strength or
marker value
2 Wideband or frequency of maximum field strength or
of the marker
3 Graphical display of field strength with indication of
selected field type (E-field in the example)
4 Spectrum with information about:
– 1kV/m: field type and measurement range
– 100 Hz: span (in addition to display top left). The
logarithmic axis scale always spans 6 decades.