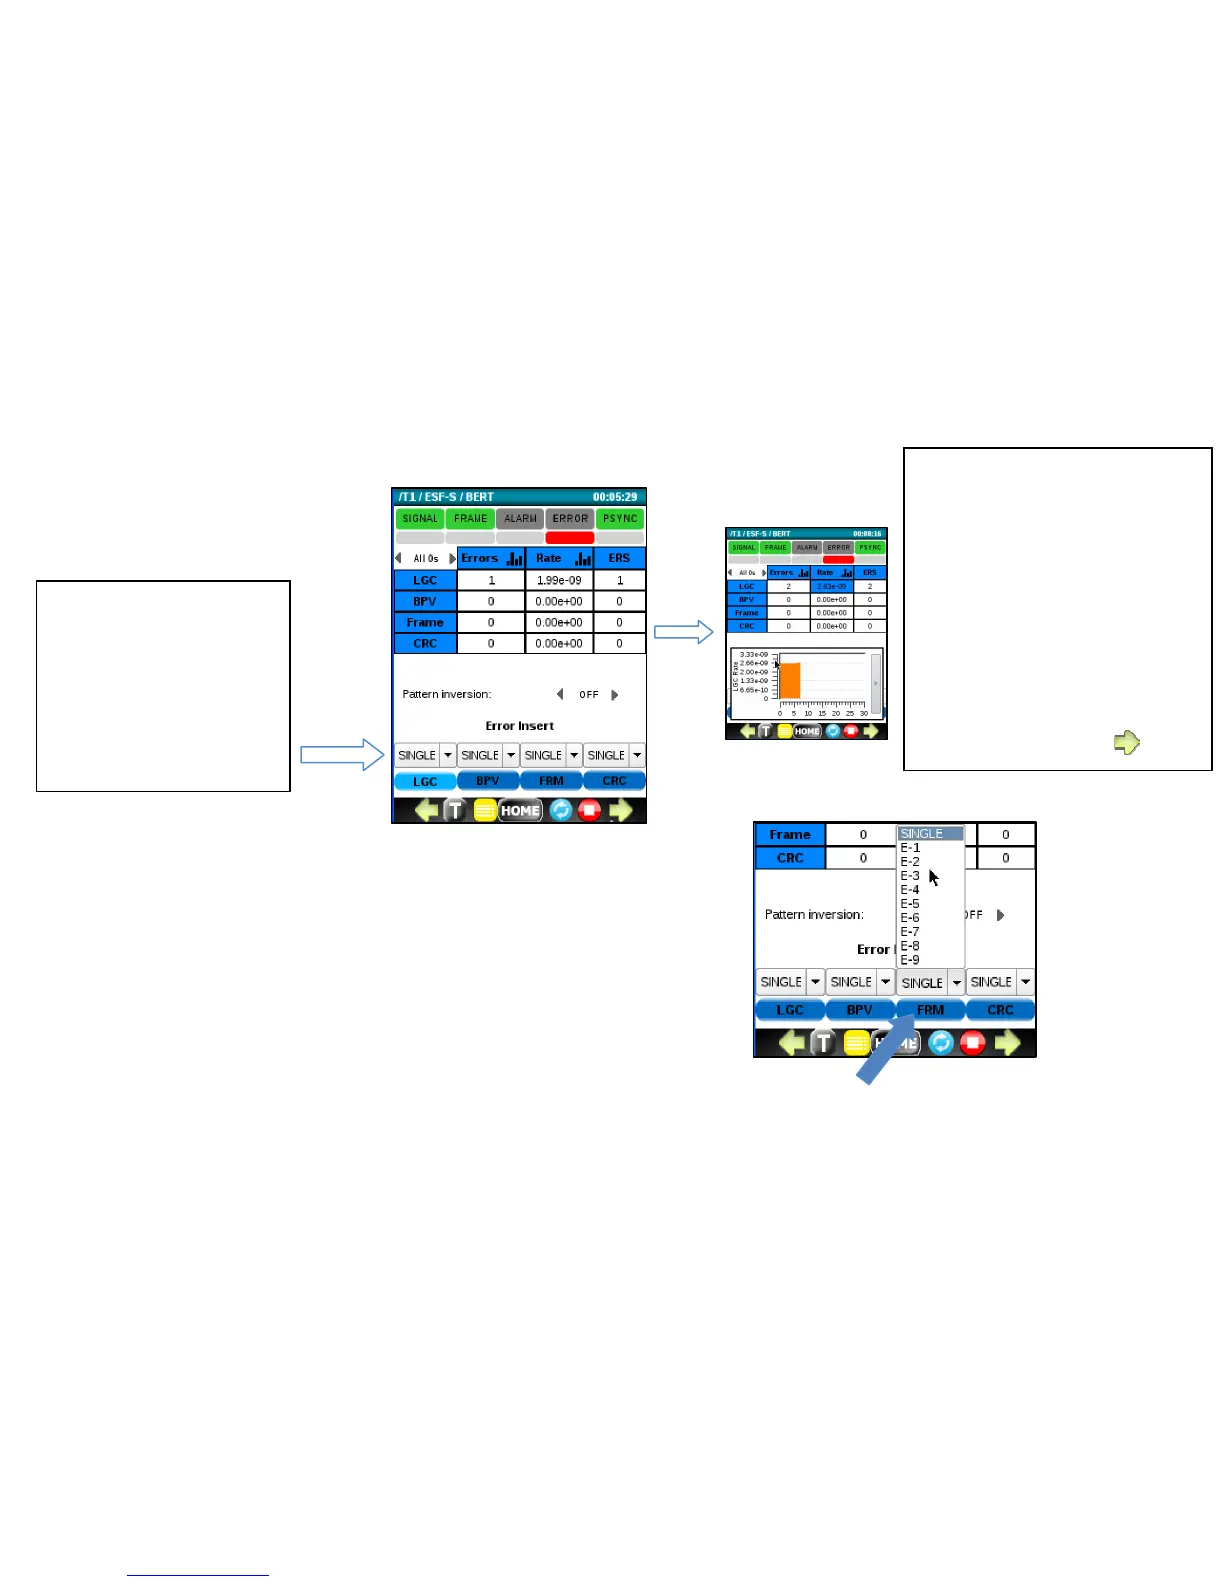
Select a rate from the pull down menu and press the corresponding
green button to begin the error RATE injection.
Click in the Errors or Rate
columns to display a histogram
for the corresponding metric.
Click on the thin gray bar to
hide it.
Green arrows at the bottom
can be used to display
additional metrics, alarms and
timeslot information.