20
4.2 Graphical User Interface (GUI)
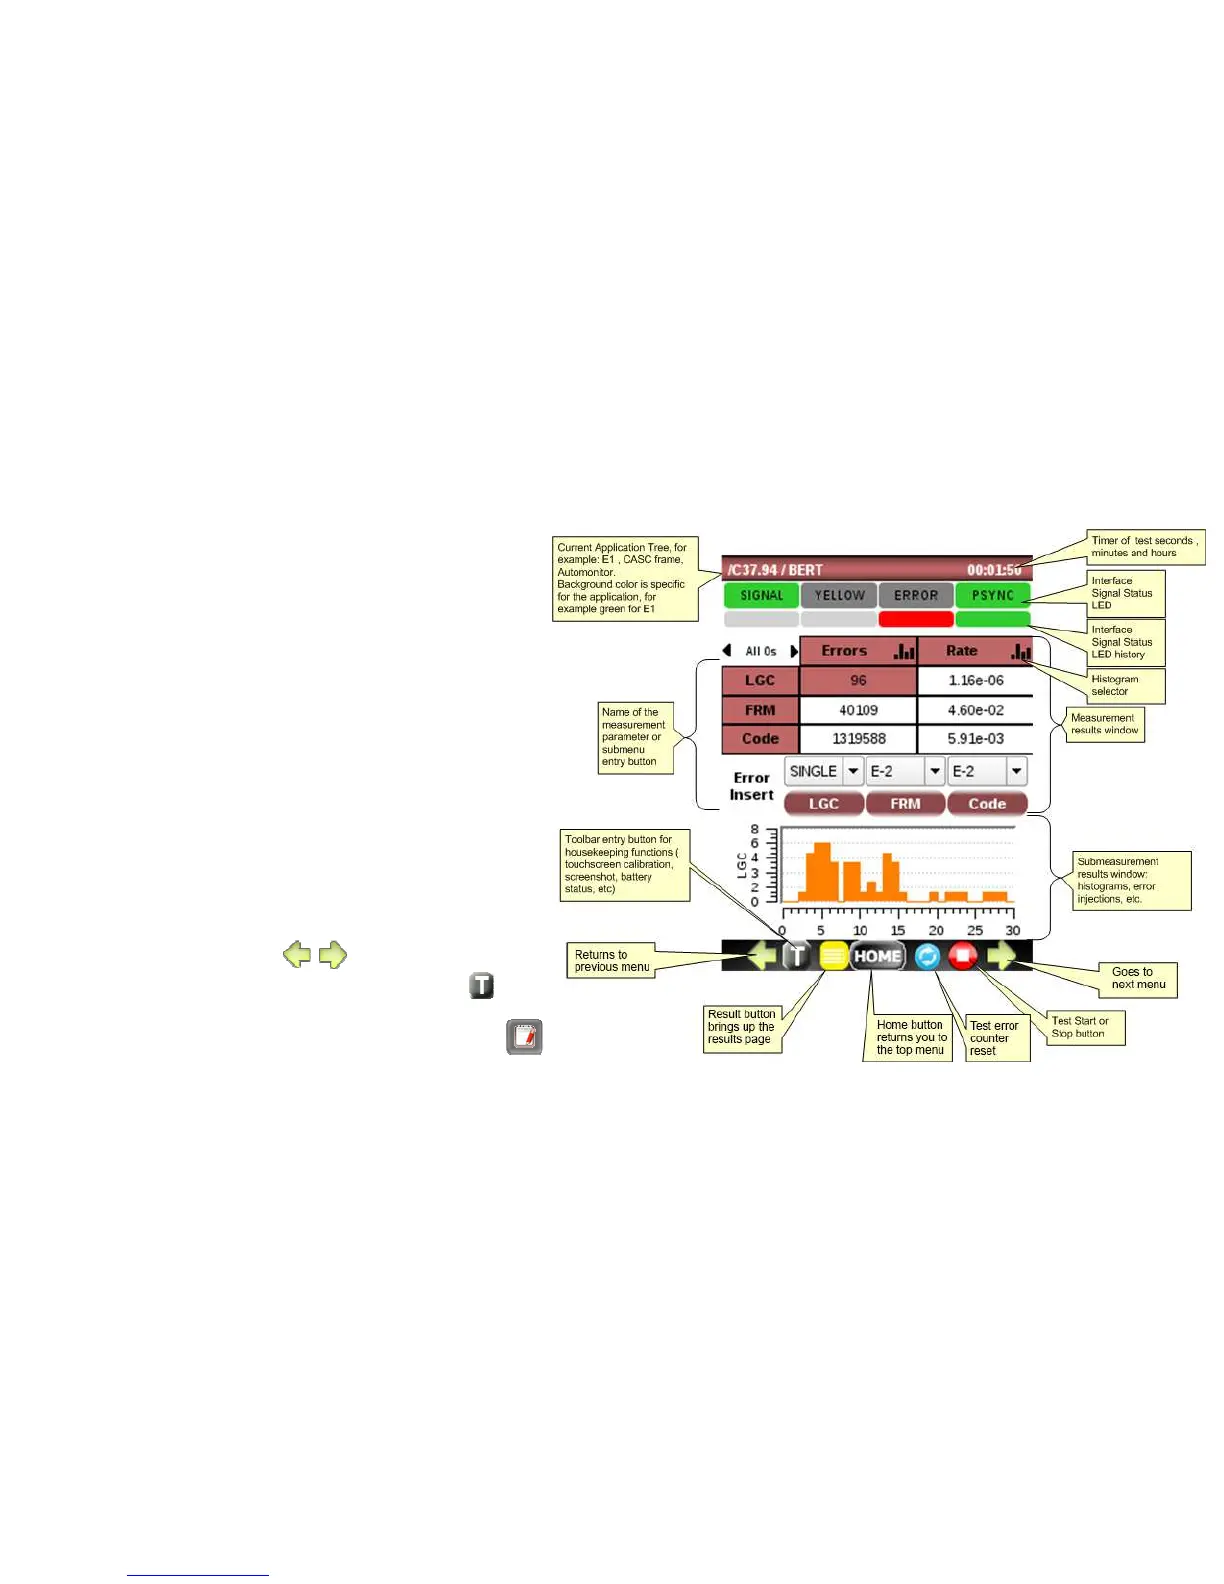
The LCD display is organized into sections:
• Application tree that shows the current
test location in the application
• Signal Status LED’s
• Signal Status history LED’s
• Measurement Results window that may
show the measurement results or a
summary status of the submenu
• Sub measurement results window such as
histogram or error injection menu
• Hot Buttons bar with:
o Go to arrows to previous or next
menu ( )
o Toolbar with housekeeping
functions listed below:
User Profiles and Config
Save/Export functions