8-Port Gigabit (PoE+) Ethernet Smart Managed Pro Switch with (2 SFP or 2 Copper Ports and)
Cloud Management
Monitor the Switch and the Traffic User Manual415
5. Click the Login button.
The System Information page displays.
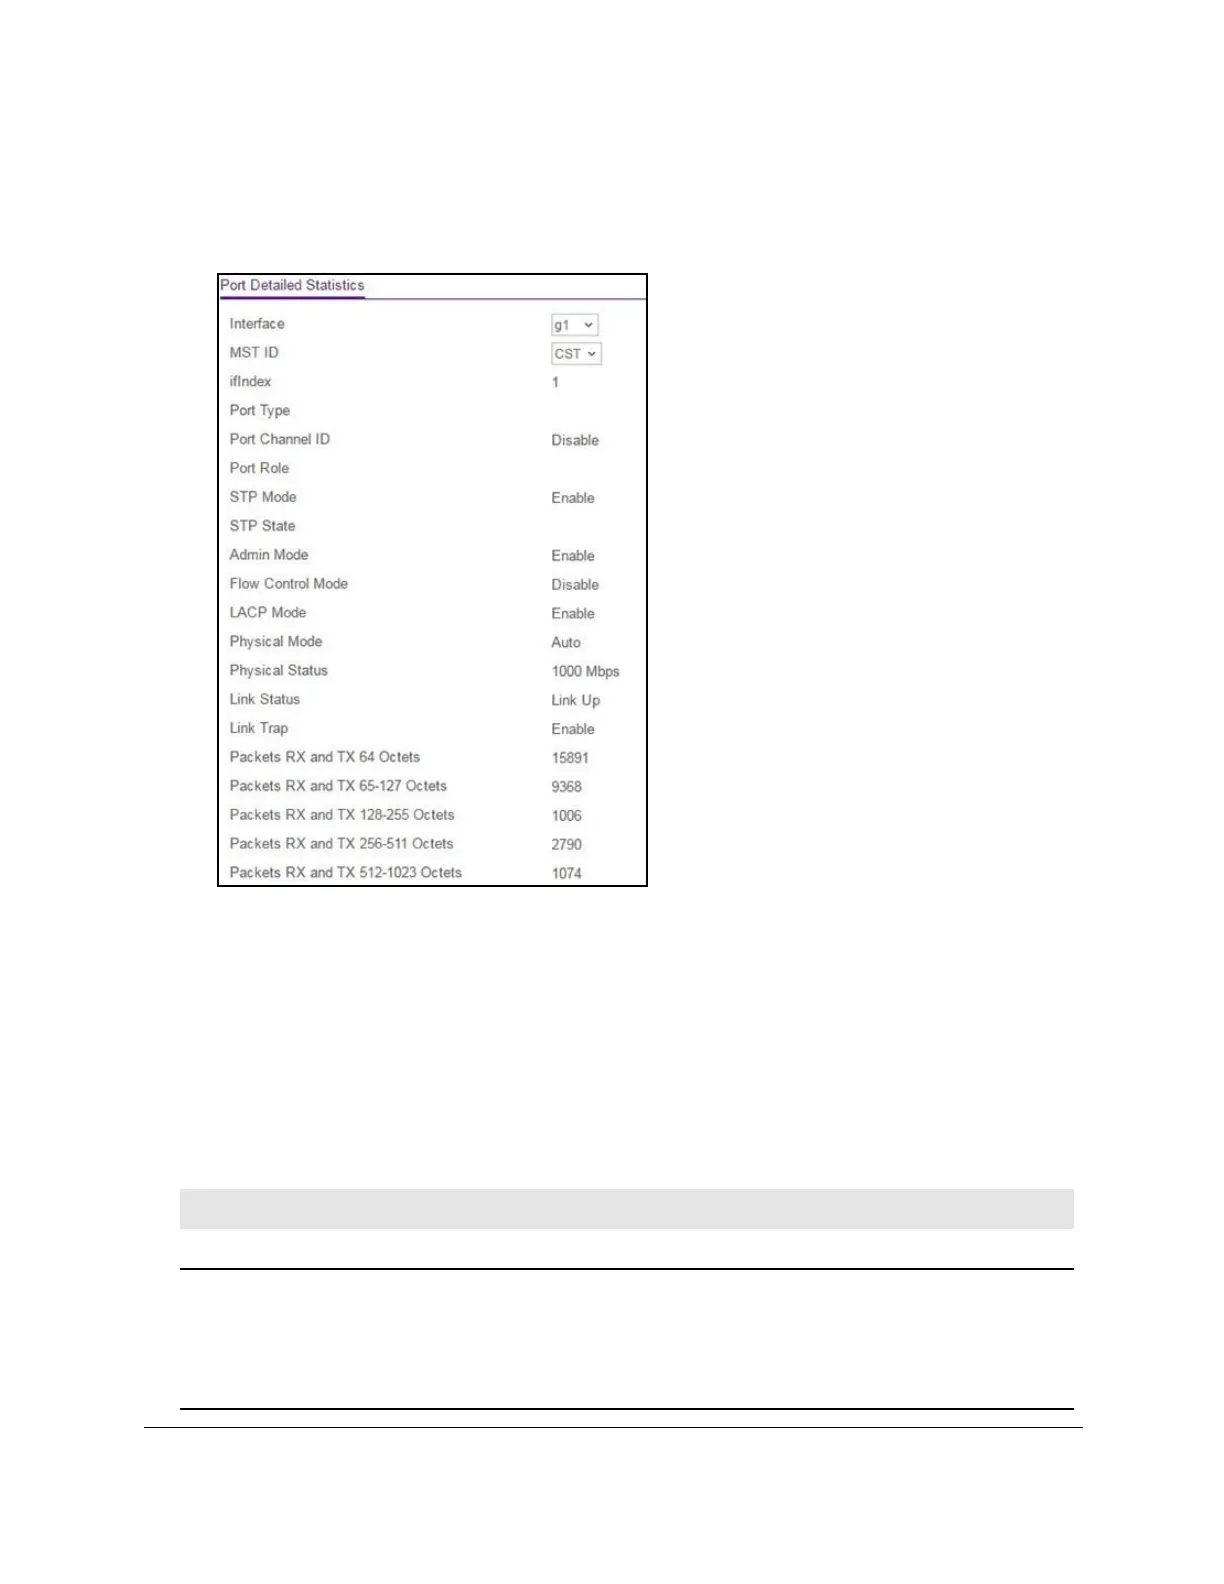
6. Select Monitoring > Ports > Port Detailed Statistics.
The previous figure does not show all fields on the Port Detailed Statistics page.
7. From the Interface menu, select the interface for which you want to view the statistics.
8. From the MST ID menu, select the MST ID associated with the interface (if available).
9. T
o refresh the page with the latest information about the switch, click the Update button.
10. T
o clear all the counters, click the Clear button. This resets all statistics for the port to the
default values.
The following table describes the detailed port information that displays for a particular port.
Table 76. Detailed port statistics
Field Description
ifIndex The interface or LAG.
Port Type For normal ports, this field is displayed as blank. Otherwise, the options are as
follows:
• Mirrored.
The port is a participating in port mirroring as a mirrored port.
• Probe.
The port is a participating in port mirroring as the probe port.
• Port Channel.
The port is a member of a LAG.