Monitor the System
381
XS708T, XS712Tv2, and XS716T Smart Managed Pro Switch User Manual
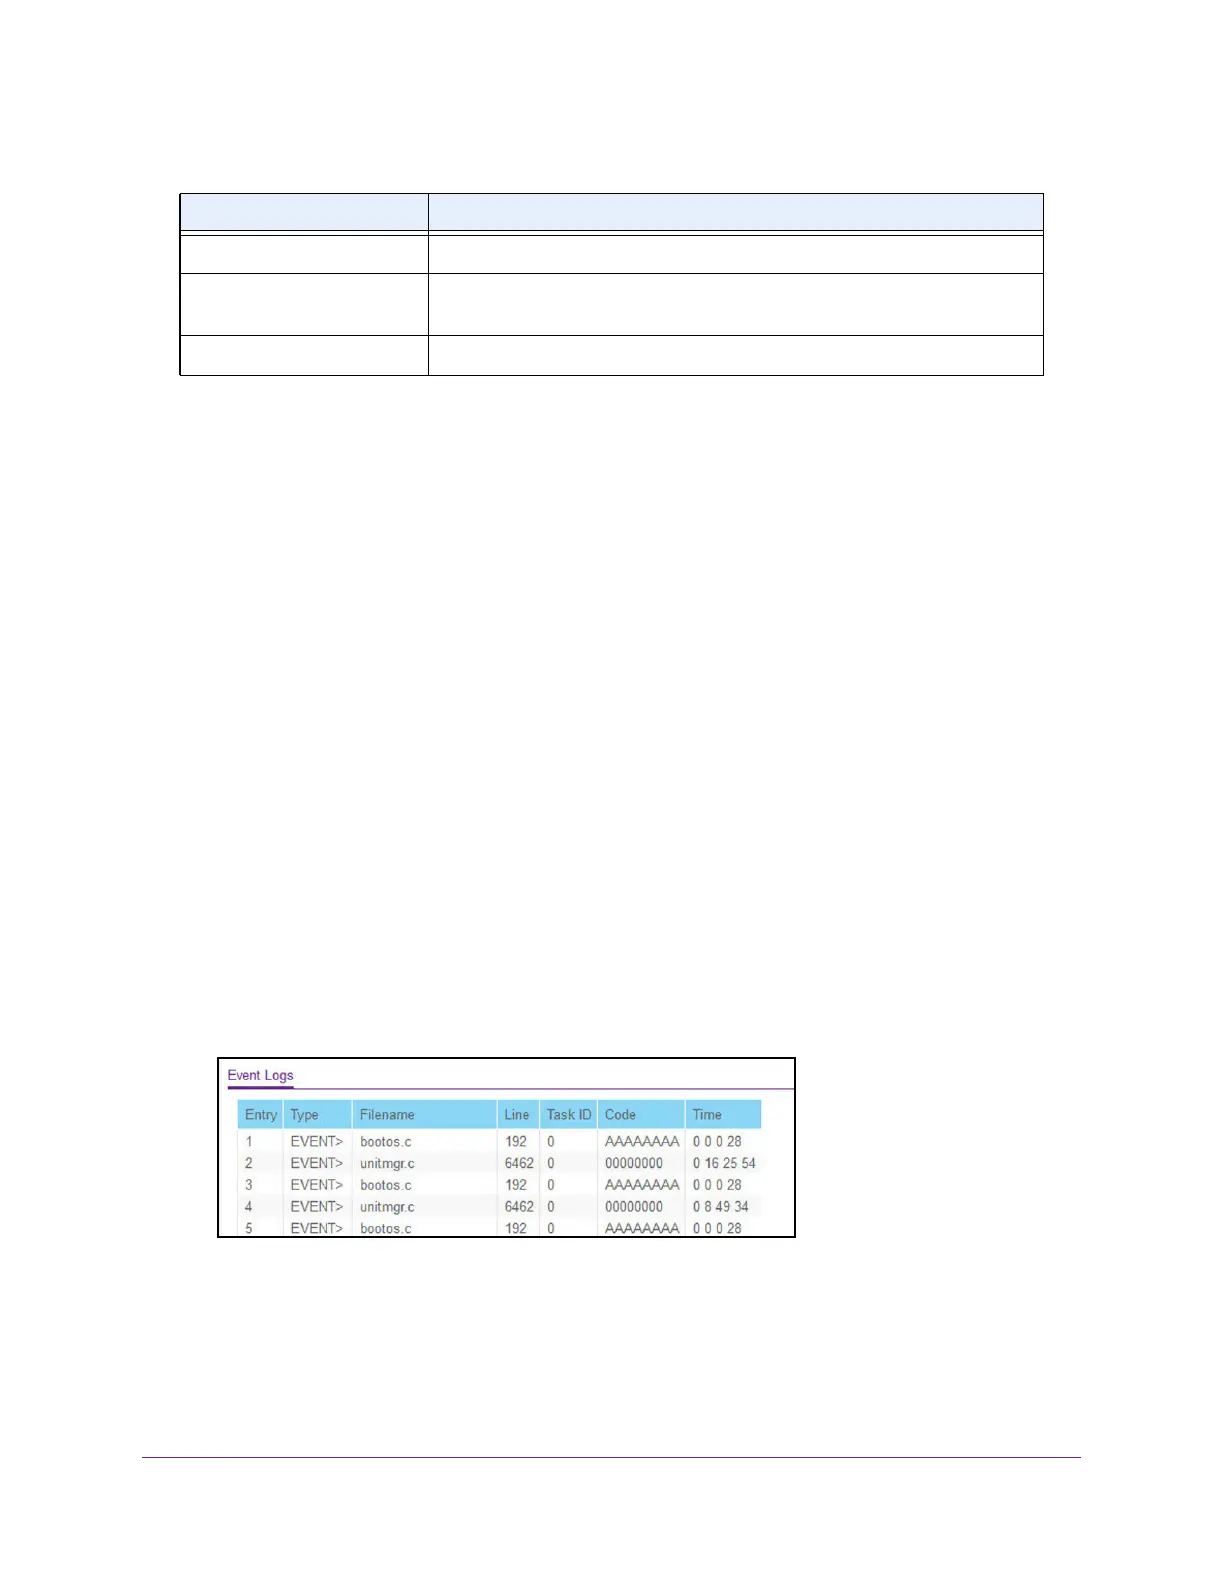
View the Event Log
Use the Event Logs page to display the event log, which is used to hold error messages for
catastrophic events. After the event is logged and the updated log is saved in flash memory,
the switch is reset. The log can hold at least 2,000 entries and is erased when an attempt is
made to add an entry after it is full. The event log is preserved across system resets.
To view the event log and clear the log:
1. Connect your computer to the same network as the switch.
You can use a WiFi or wired connection to connect your computer to the network, or
connect directly to a switch that is off-network using an Ethernet cable.
2. Launch a web browser.
3. In the address field of your web browser, enter the IP address of the switch.
If you do not know the IP address of the switch, see Change the Default IP Address of the
Switch on page 10.
The login window opens.
4. Enter the switch’s password in the Password field.
The default password is password.
The System Information page displays.
5. Select Monitoring > Logs > Event Logs.
6. To refresh the page with the latest information about the switch, click the Update button.
7. To clear the messages from the event Log, click the Clear button.
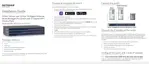
Log The sequence number of this trap.
System Up Time The time when this trap occurred, expressed in days, hours, minutes, and
seconds, since the last reboot of the switch.
Trap Information identifying the trap.
Table 92. Trap Logs information (continued)
Field Description
 Loading...