Checking the Trend of Measurement Results with Graphs
64
FQ-CR2 User’s Manual
6-3 Checking the Trend of Measurement Results with Graphs
Measurement result histories can be checked using the trend monitor and histograms.
Trend Monitor
Changes in the measurement values of the selected inspection item against time can be observed from the
graph. It becomes possible to predict when malfunctions may occur or to analyze the cause of the malfunction
by checking the trends in the measurement values. The most recent 1,000 measurement values are displayed
on the graph.
• [Trend Monitor] Display
(Run Mode) − [Select display] − [Trend monitor]
Arranging the Trend Monitor Display
The display range for the vertical axis and display conditions for the horizontal axis can be changed. However,
the display range and the number of data settings are disabled when a display other than the trend monitor is
displayed.
• Disabling Automatic Selection of the Display Range
1 Press [ ] − [Auto display] on the right of the trend monitor.
2 Press [OFF].
• Changing the Display Range of the Vertical Axis
1 Press [ ] − [Display range] on the right of the trend monitor.
2 Set the minimum and maximum values of the measurement values.
• Changing the Number of Values That Are Displayed
1 Press [ ] − [Number of data] on the right of the trend monitor.
2 Select the number of values from 200, 400, and 1,000.
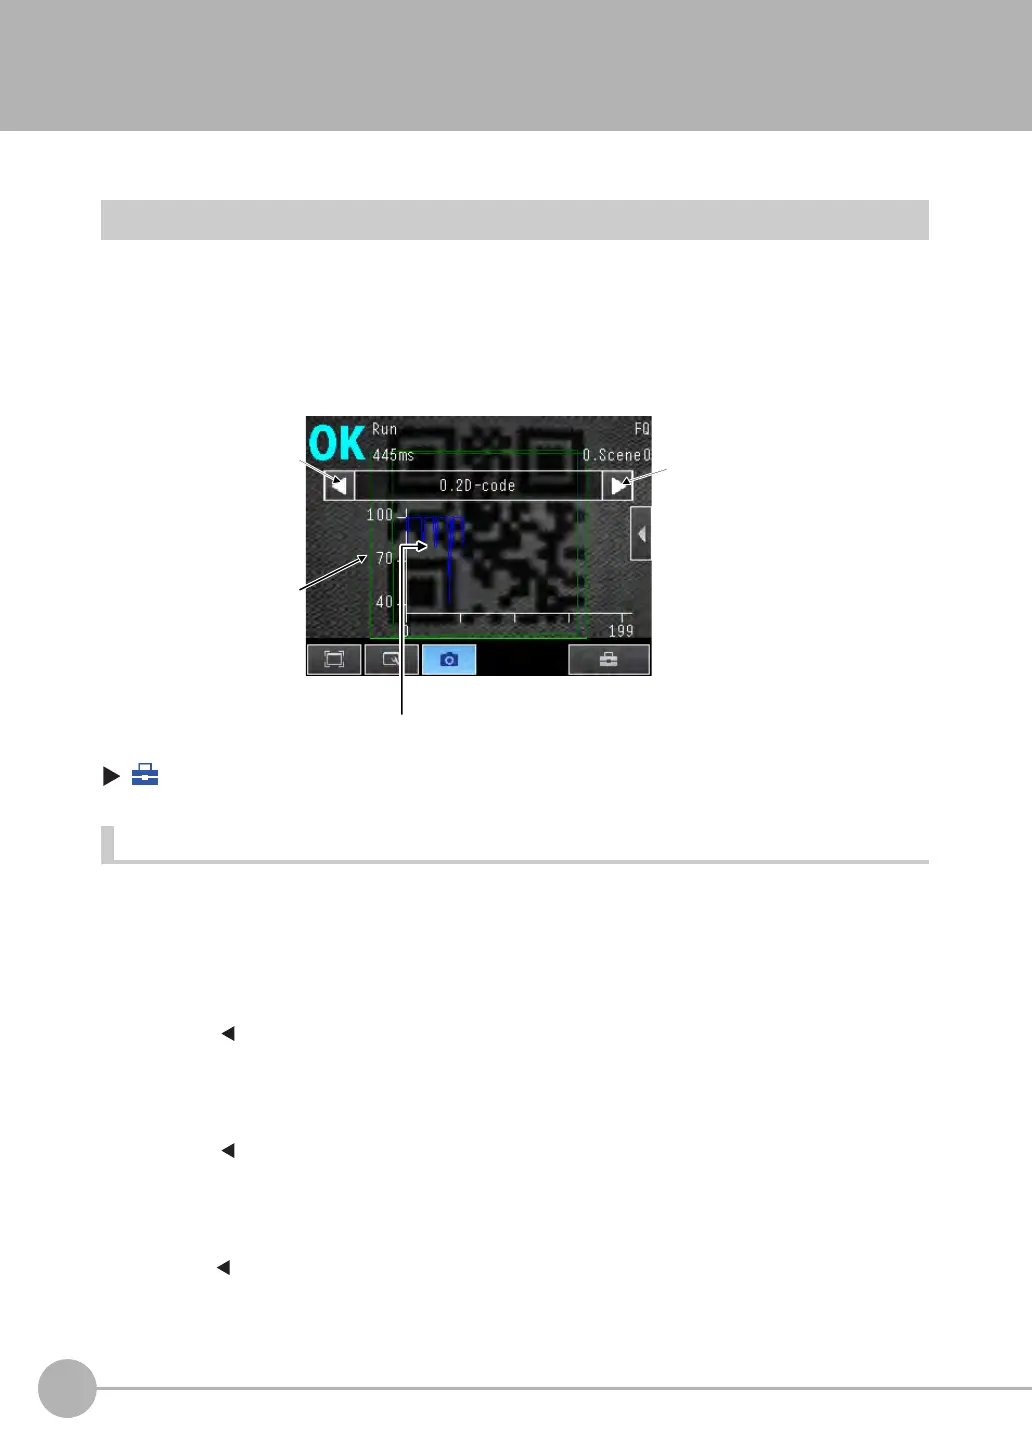
Changes in the measured value of the selected
inspection item are displayed against time in a graph.
Measurement
values
Switches the display
to the previous
inspection item
number.
Switches the display to the
next inspection item number.
FQ Sensor User Manual.book 64 ページ 2011年7月8日 金曜日 午後2時30分