Handbook
November 2011 / 59-UMC0071 / Issue 01
Mercury iTC
Page 37
USER INTERFACE
Original Instructions
3.2.8 Plot page
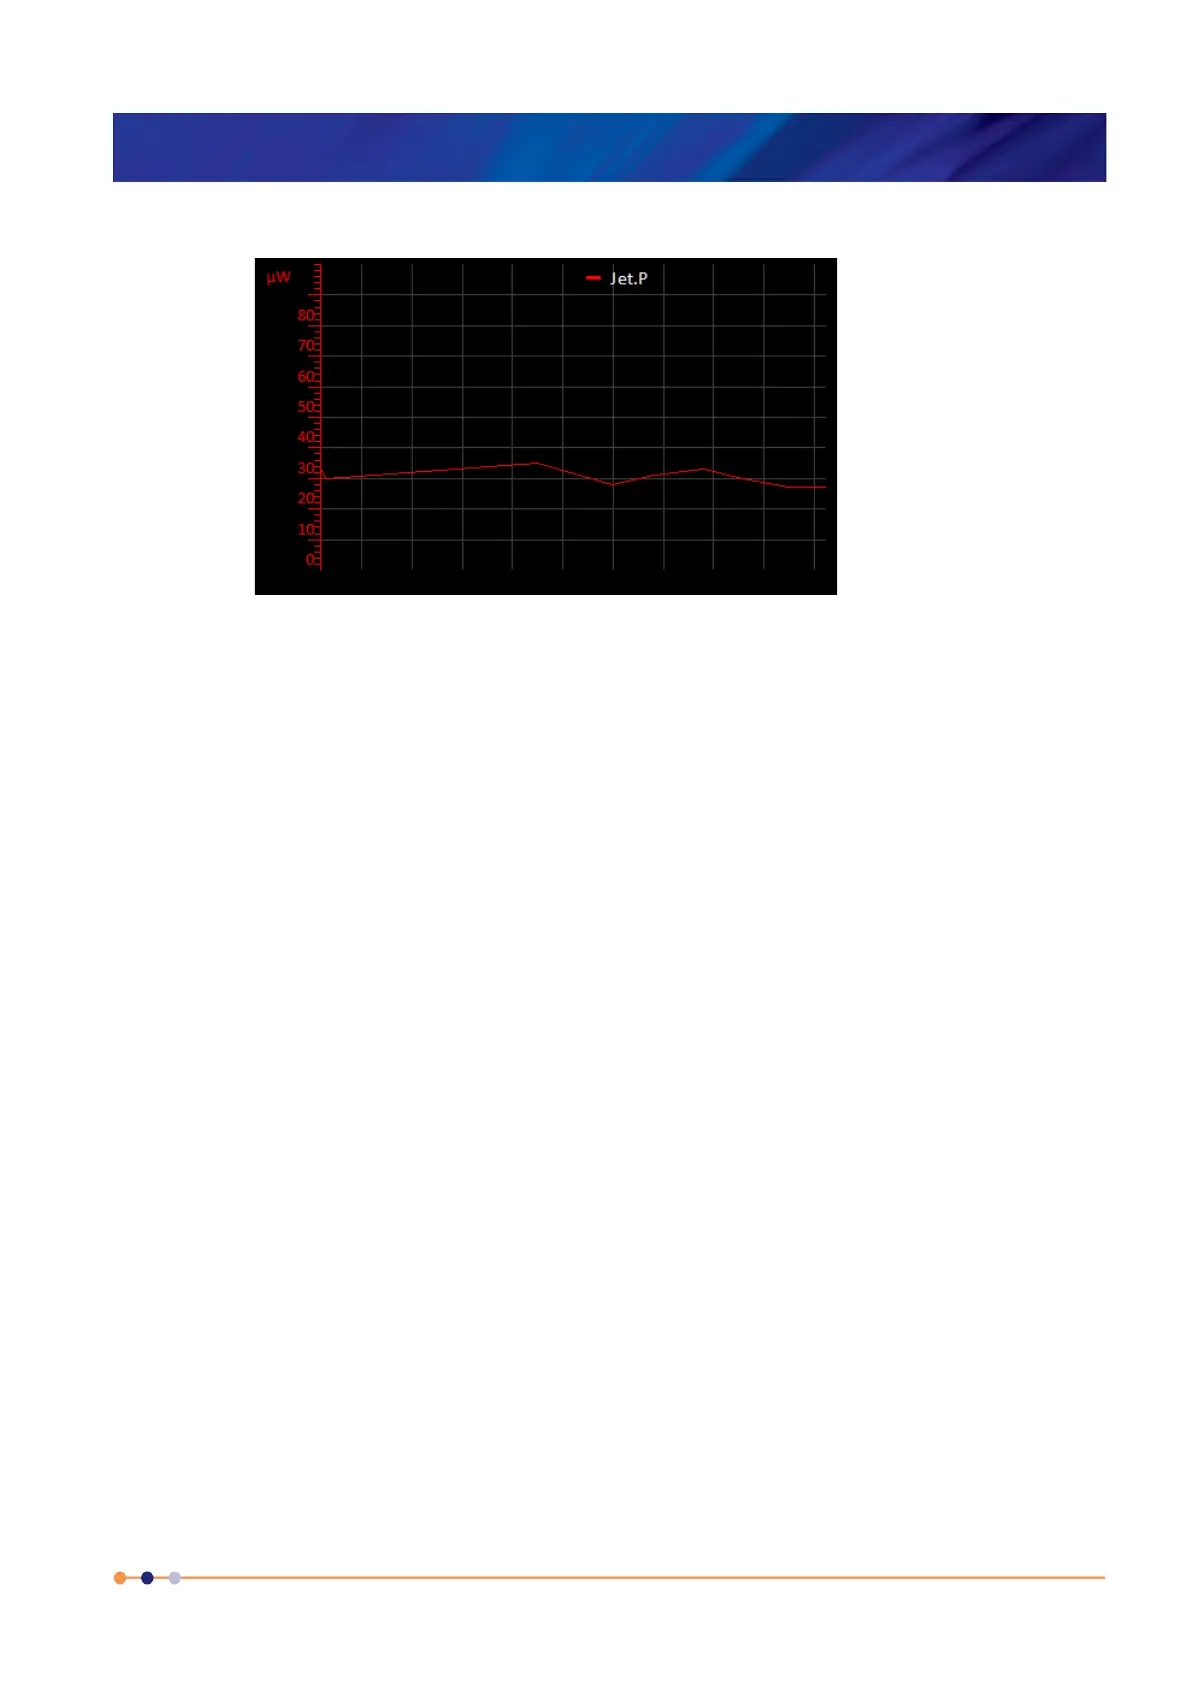
Figure 3-19 Typical Signal Monitor Plot page
The Plot page can display up to six different values plotted against time.
If a plot has been configured, the trace updates in real time.
By default, the Plot page displays a scale on the Y-axis only.
a) Tap at the bottom of the page to display the X-axis scale.
b) Double-tap anywhere on the page to display the Plot Configuration page (see
Section 3.2.9).
3.2.8.1 Adjusting the plot scaling
To adjust the scaling of a plot:
1 Place a finger on the region of interest of the plot. The re-scaled plot will be centred
around this position.
2 Drag the finger to zoom in and out around the area of interest:
a) Drag the finger to the right to expand the X-axis (zoom in).
b) Drag the finger to the left to contract the X-axis (zoom out).
c) Drag the finger up to expand the Y-axis (zoom in).
d) Drag the finger down to contract the Y-axis (zoom out).
These motions can be combined. For example, dragging the finger towards the
bottom right corner expands the X-axis and contracts the Y-axis.
3 Double tap on a scale to return to the default scaling for that axis.
 Loading...