Handbook
November 2011 / 59-UMC0071 / Issue 01
Mercury iTC
Page 36
USER INTERFACE
Original Instructions
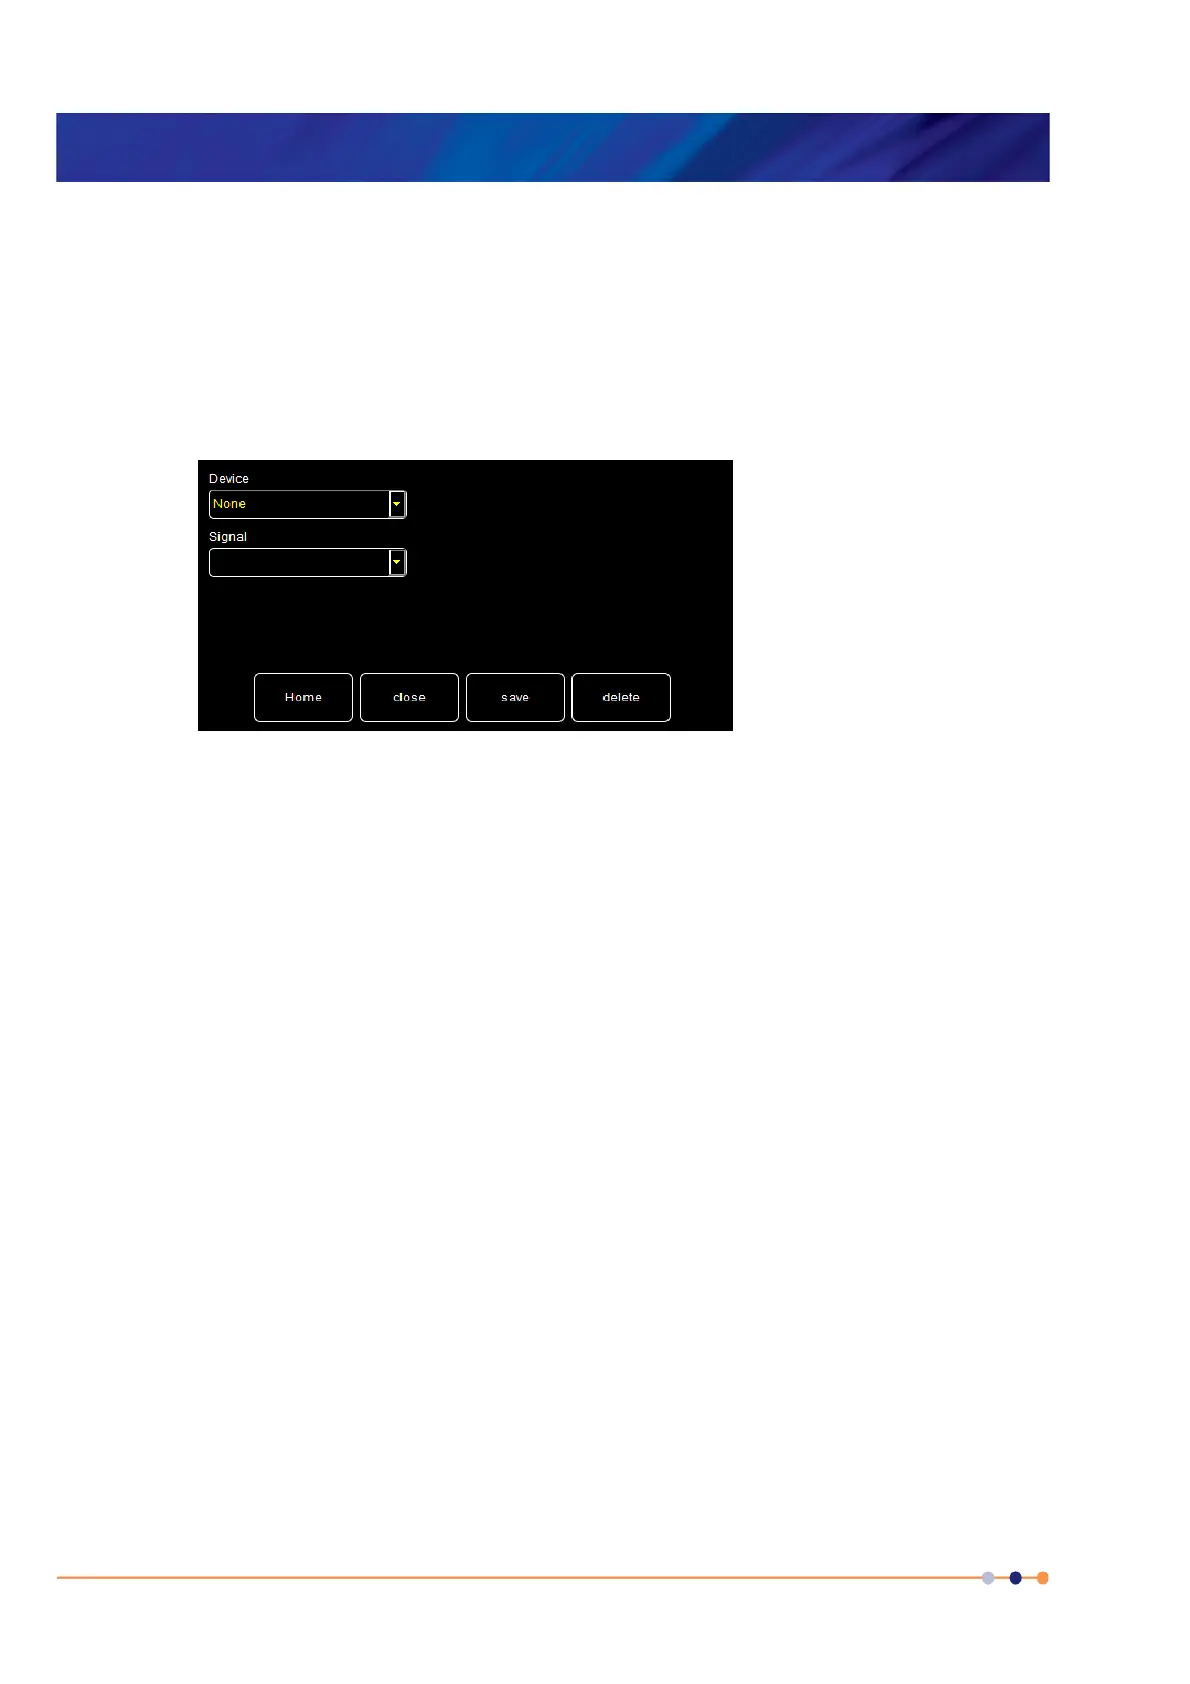
3.2.7 Plot Configuration page
The Plot Configuration page allows the user to select one or more signals to be plotted
against time.
To access the page:
1 If no plots have been configured, tap the Plot button on the Home page.
2 If a plot is displayed, tap the plot area once. The Plot Configuration page appears
as an overlay on the Plot page.
Figure 3-18 Plot Configuration page
The page contains the following fields and controls:
Device
Select a device from a drop-down menu.
Signal
Select a signal to display from a drop-down menu.
Close
Tap once to close the Plot Configuration page without saving any changes that have
been made.
Save
Tap once to add the selected trace to the plot.
Delete
Tap once to remove the selected trace from the plot.
 Loading...