Handbook
November 2011 / 59-UMC0071 / Issue 01
Mercury iTC
Page 89
BASIC OPERATING INSTRUCTIONS
Original Instructions
6.3.5 Stopping a sweep
1 Tap Control on the Home page. The Control Loop Configuration page is displayed.
2 Select the required temperature-sensor in the Sensor field.
3 Tap the Set (K) button until it displays Manual. The Set (K) field value is held at its
present value.
6.4 Using the plot function
6.4.1 Configuring a plot
1 Tap Plot on the Home page. The Plot Configuration page is displayed.
2 Tap Device and select the first device to be used.
3 Tap Signal and select the first signal to be plotted.
4 Tap Save to plot the first signal.
5 To add traces to the plot, double-tap anywhere on the plot area and repeat steps 2
to 4.
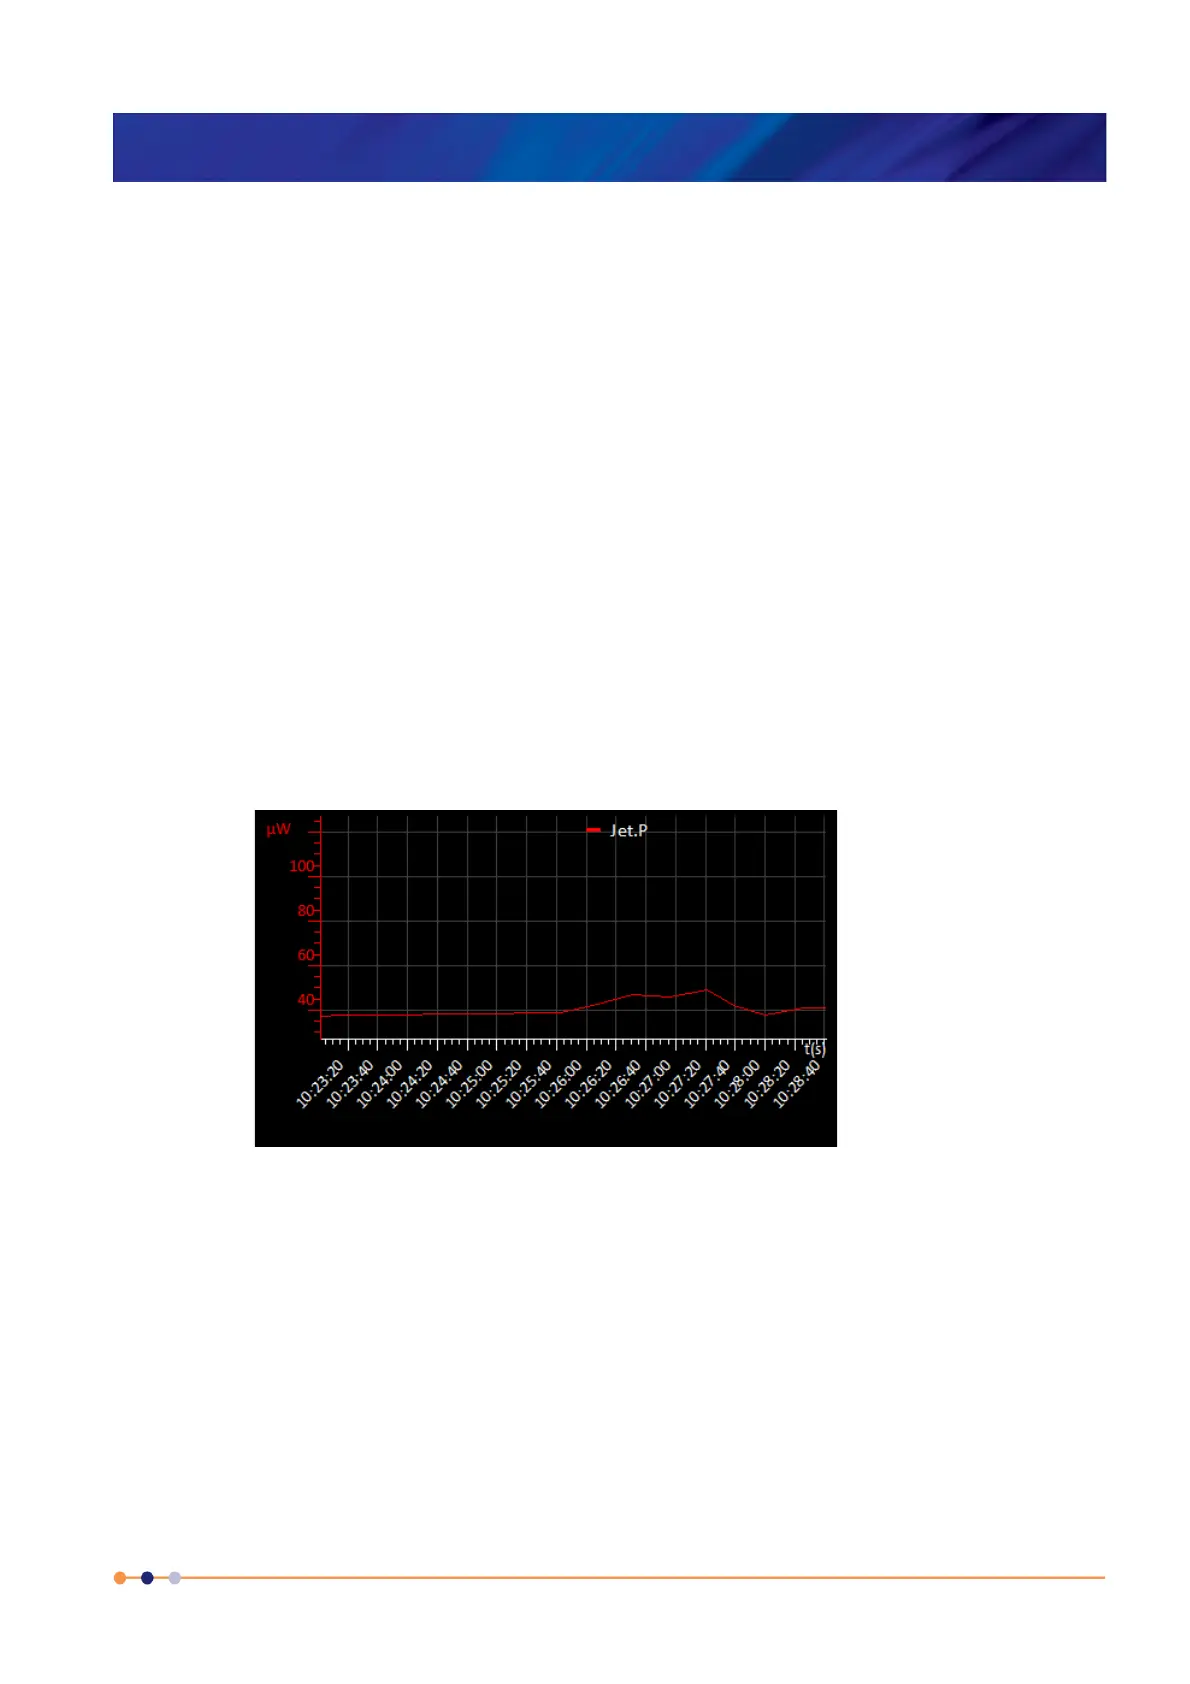
6 If required, tap once in the area below the plot to add a scale on the X axis (see
Figure 6-1).
Figure 6-1 Signal Monitor Plot page with X and Y axis scales
 Loading...