CIRAS-3 Operation Manual V. 1.09 150 support@ppsystems.com
A user defined value representing the maximum CO
2
concentration (µmol mol
-1
).
If the CO
2
concentration reaches this level, the measurement sequence will end.
A user defined value representing the maximum time (seconds). If the time
reaches this interval, the measurement sequence will end.
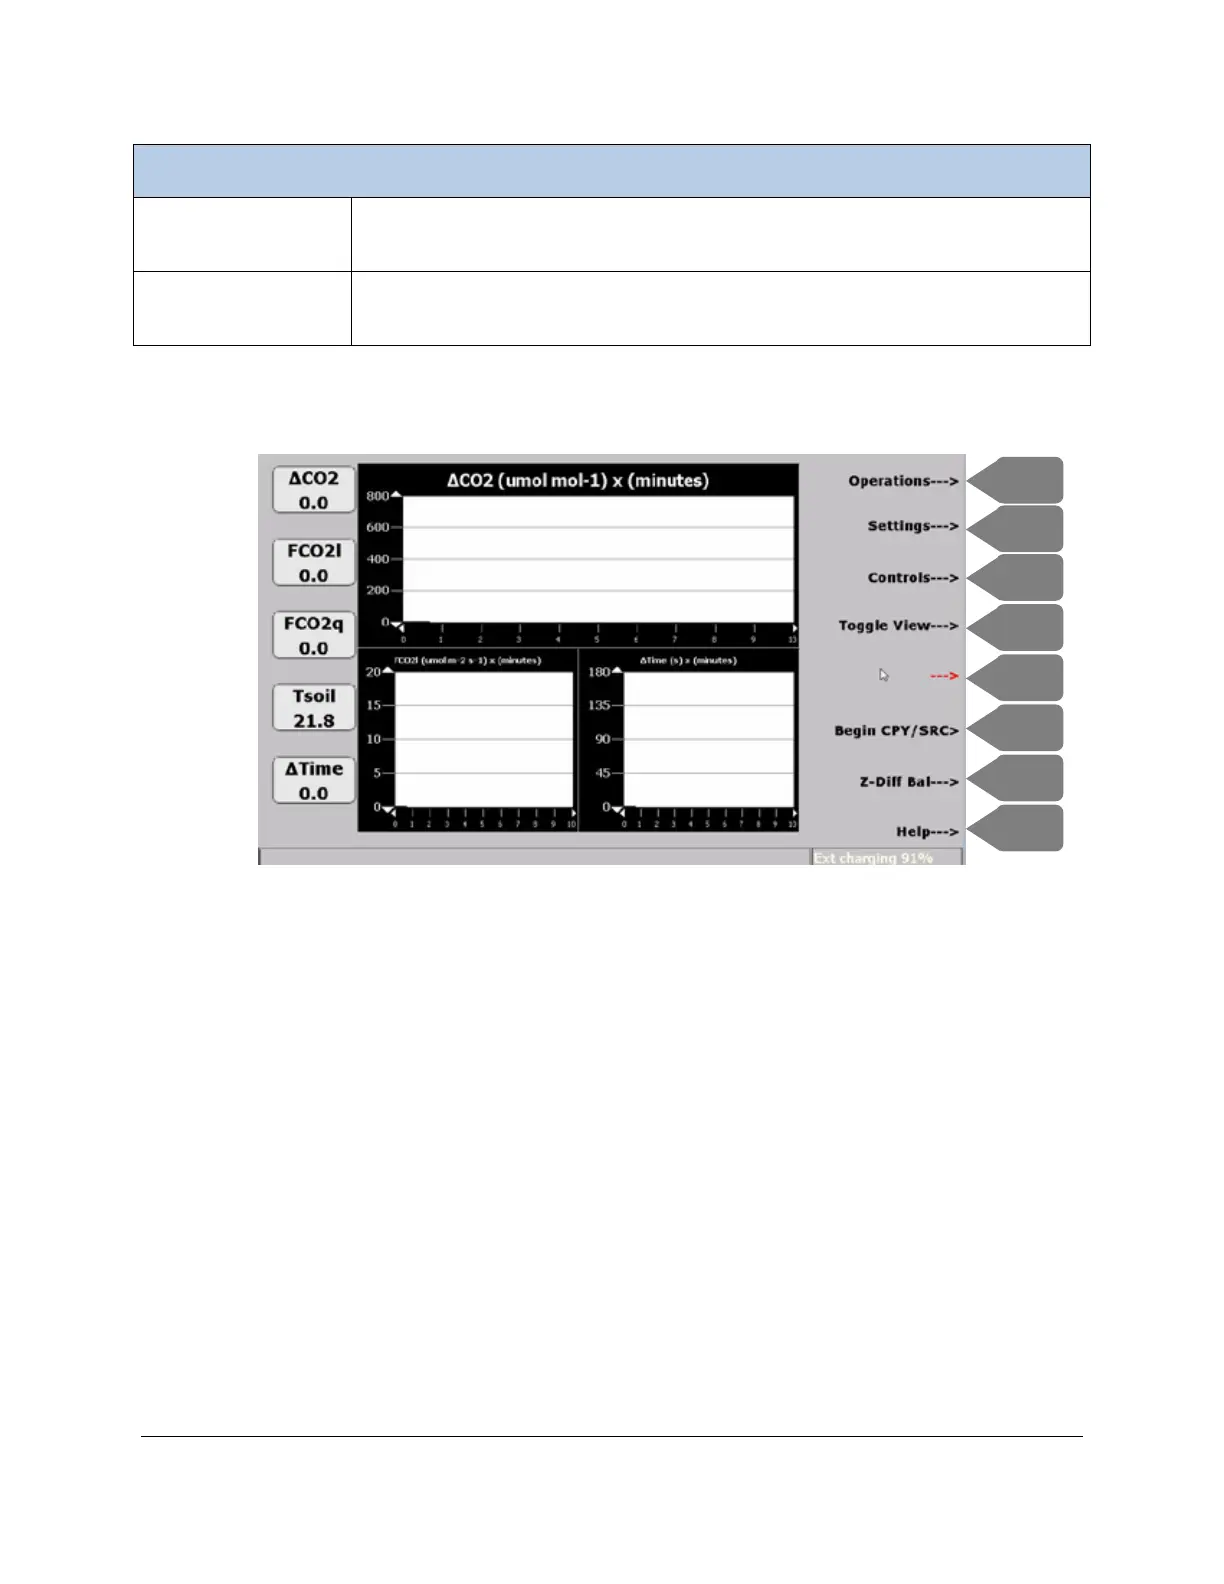
Graphical Data Display (SRC-1/SRC-2 and CPY-4/CPY-5)
The information that is included on the graphical display is dependent on user settings under Graph Set
(Settings (F2) >Graph Set (F5)).
Measurement Sequence
Once you have selected the appropriate accessory (SRC-1, SRC-2, CPY-4 or CPY-5) including defaults
and/or other user settings, the typical measurement sequence is as follows:
1. Begin CPY/SRC
2. Hold Chamber in Air to Flush – Data collection begins in x Sec
3. Position Chamber on Soil
4. Chamber equilibrating
5. Data Collection Started
6. Sequence complete.