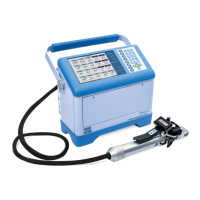
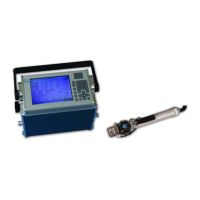
CIRAS-3 Operation Manual V. 1.09 78 support@ppsystems.com
Enter a known or estimated value of % upper leaf surface stomata for your leaf
sample. If you are unsure, it will help if you can determine if your leaf sample is
representative of a hypostomatous or amphistomatous plant species before
entering an estimate.
Settings Graph Set (F5)
The alternative to Numeric View is called Graph View. Configure Graph View in Settings (F2) > Graph
Set (F5). In Graph View you can view up to 5 numeric variables and 3 graphs, using any combination of
measured and calculated data in the graphs. Select your desired set of variables from the Variable list,
Variable 1 through Variable 5. With the dropdown box highlighted, press Expand List (F4) to see a
section of the total list, or use the Up or Down arrows to move quickly through the list. The first variable in
the list is None. Choose None if you do not want numeric variables displayed or make a selection and
press OK. The graph or graphs that you choose to display can be customized in two basic ways: the
variables that will be shown and the numeric min-max scaling or time scale. Press the TAB key to move
down to Graph1. Y Axis is the first dropdown list containing all available variables. Again, with the
dropdown box highlighted, make your selection. Press TAB again to enter a value in the Min field, then
do the same for the Max field. Press Change Sign (F3) to enter a negative value after you make your
entry, usually in the Min field. Note that if you clear the field by pressing the DEL (delete) key the
selection defaults to Auto, which will auto-scale that entry.
X Axis is the next dropdown list. The first variable that it contains is Time Span – choose this if you want
a single-variable plot, displayed over a period of between 2 and 60 minutes. Enter the time in the next
field, Span. Min and Max will be grayed out. Enter any variable except Time Span if you prefer a two-
variable scatter plot, then enter the Min and Max scales for that variable. The Span field will be grayed
out.
The first variable in the Y Axis list is None. Choose None if you do not want the graph displayed. For
example, if you set up Graph1 as described above and select None for both Graph2 and Graph3, you will
see a single large graph. Select None for Graph3 to display two graphs only, etc.