EasyManuals Logo

PP Systems CIRAS-3 User Manual

PP Systems CIRAS-3
204 pages
To Next Page IconTo Next Page
To Previous Page IconTo Previous Page
Page #81 background imageLoading...
Page #81 background image
CIRAS-3 Operation Manual V. 1.09 81 support@ppsystems.com
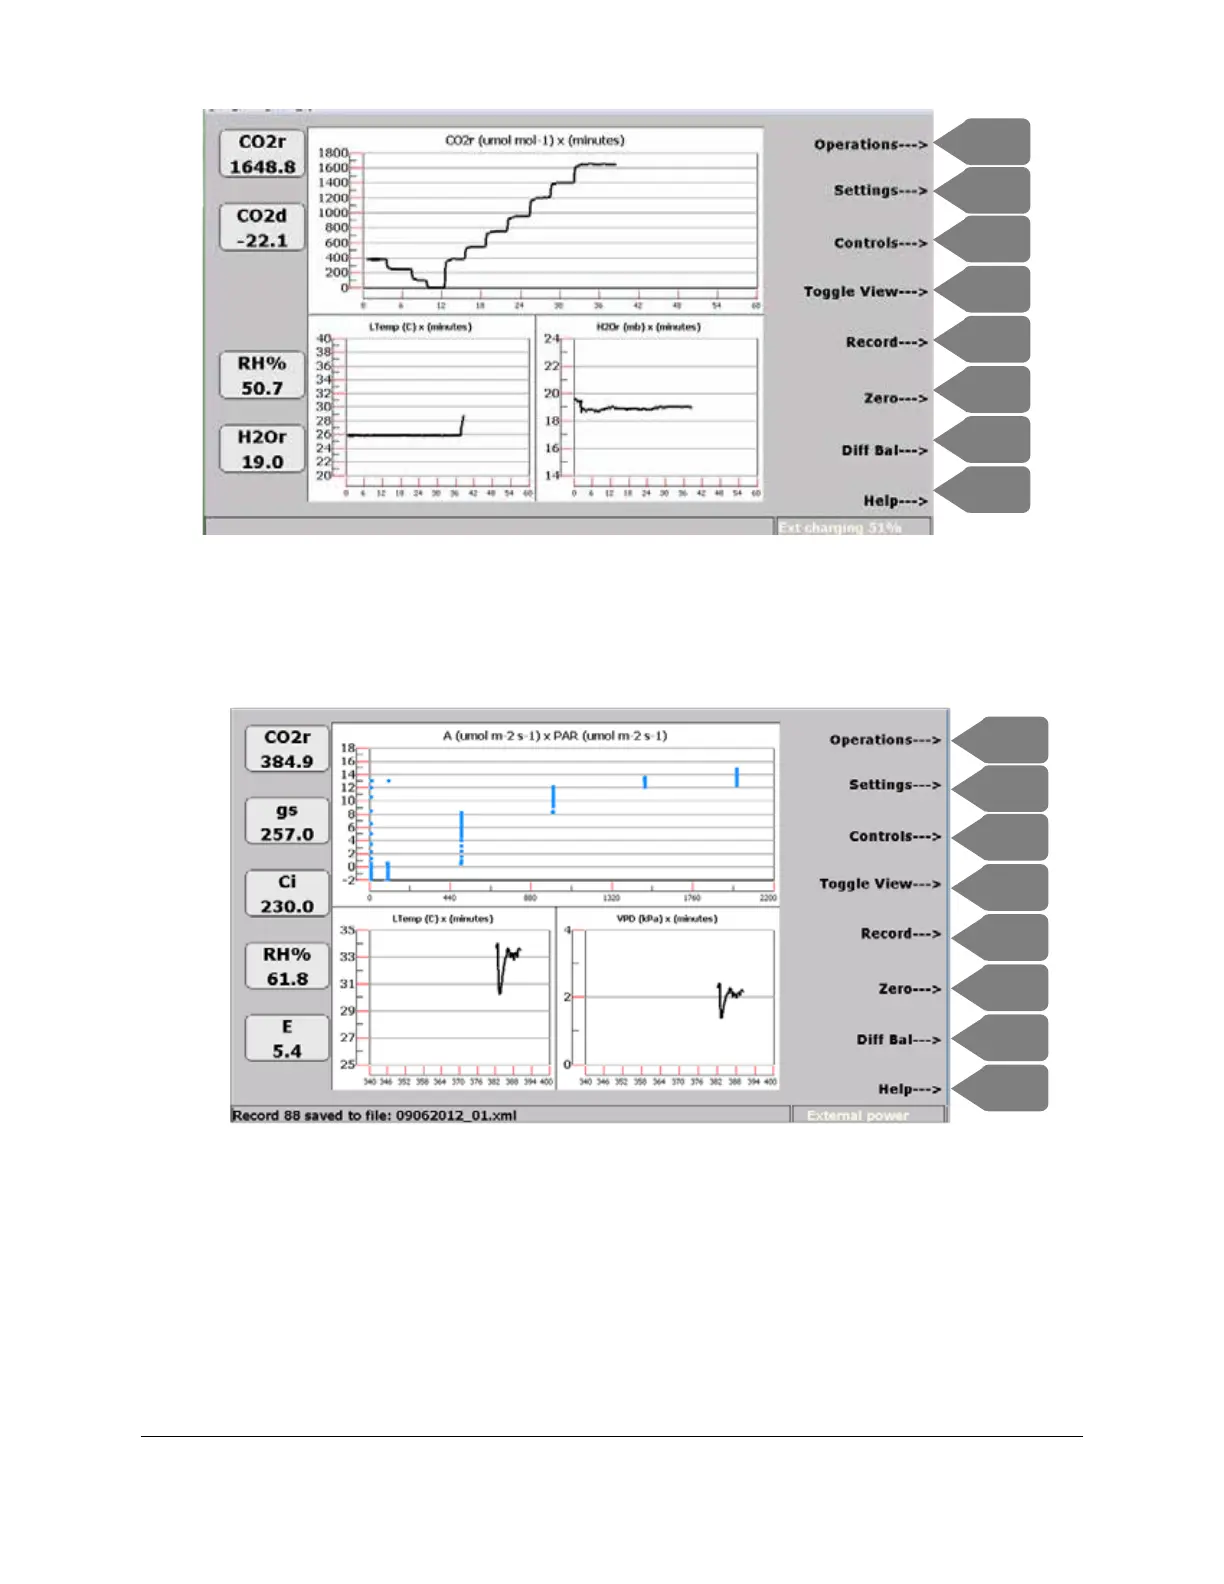
The second example (below) features a two-variable scatter plot of A x PAR. This graph captures a light
curve, with each vertical group of blue markers representing photosynthetic acclimation at subsequent
increasing light levels (X axis) between 0 and 2000 µmol m
-2
s
-1
.
F1
F3
F2
F4
F6
F5
F7
F8
F1
F3
F2
F4
F6
F5
F7
F8

Table of Contents

Questions and Answers:

Question and Answer IconNeed help?

Do you have a question about the PP Systems CIRAS-3 and is the answer not in the manual?

PP Systems CIRAS-3 Specifications

General IconGeneral
BrandPP Systems
ModelCIRAS-3
CategoryMeasuring Instruments
LanguageEnglish

Related product manuals