PVA-3000 Reference Manual
December 2, 2019 Sifos Technologies
5.5. Standard PHY Performance Test Report
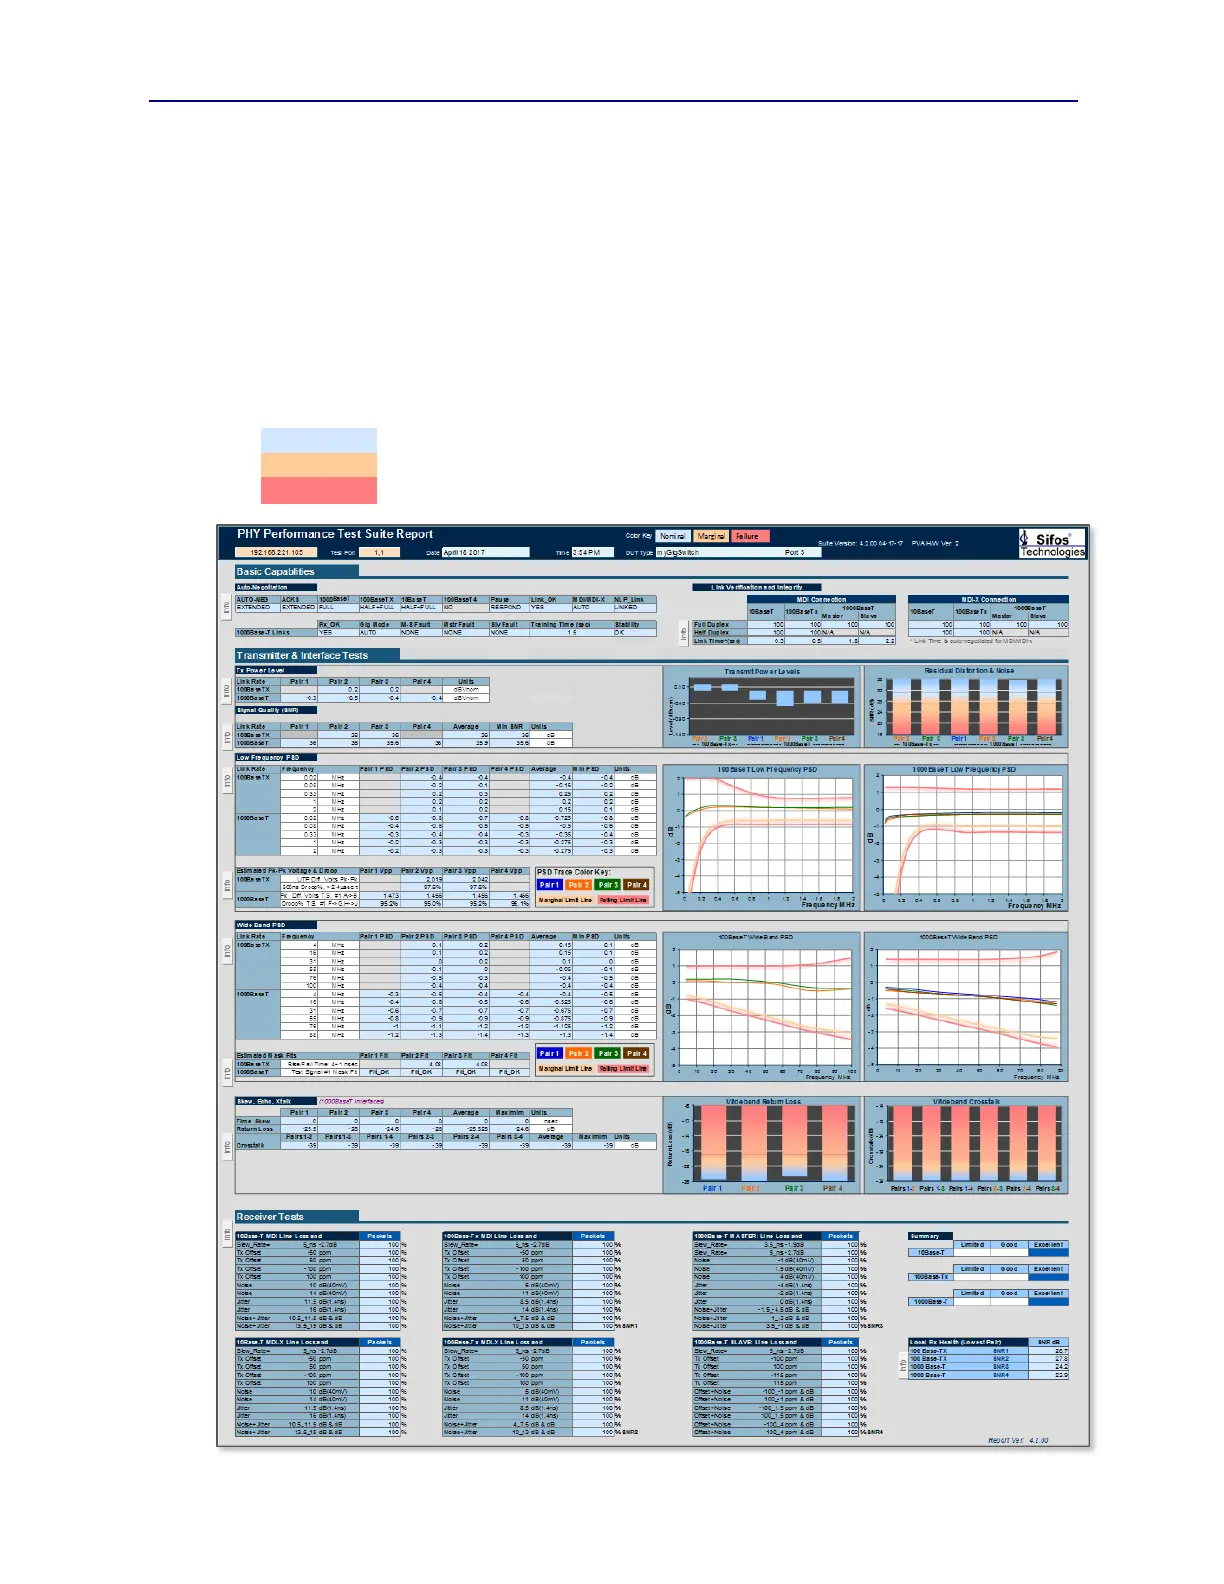
The PHY Performance Test results are presented in a multi-page, colorful Excel spreadsheet, titled PhyView LAN
PHY Performance Report. An example is shown in Figure 5.1. (Note: In order to produce this report, the host PC
running PVA software must have Microsoft Excel version 2007 or later installed.)
The report presents results from the three fundamental areas covered by the PHY Performance Test Suite. The Basic
Capabilities results are shown at the top of the report, the Transmitter and Interface results are in the middle, and the
Receiver test results are at the bottom. The report is structured so that each port tested in a sequence produces a
specific worksheet tab (or page) dedicated to that port. Up to 24 ports of data can be displayed in a single report.
The standard report includes colorized graphics and colorized annotations of test limit excursions. Most of the
parameters are evaluated against two-tiered limits that are documented in the “limits” page of the report. These limits
will show performance falling in one of three bands:
Exceeds applicable 802.3 specifications
On or near the limit of one or more 802.3 specifications
Probable 802.3 limit violation(s)
Figure 5.1 PHY Performance Test Suite Standard Report