PVA-3000 Reference Manual
December 2, 2019 Sifos Technologies
Averages is a configuration option to the SNR, PSD, Echo, and Xtalk meters. Each of the underlying metrologies for
these meters involves a combination of sample acquisition and analysis that can be repeated and averaged in order to
remove effects of noise and short term digital signal processing artifacts. In general, more averaging should produce
better statistical accuracy with a small time penalty. One
special case is (low-band) PSD with start frequency below 1
MHz will always require maximum averaging of 64.
3.10.3. PSD Frequency Range & Trace Display
Two configuration settings are unique to just the PSD
measurement and are only enabled when PSD is selected in
the Meter Type menu. Frequency Range (MHz) specifies
the start and stop frequencies for a Power Spectral Distortion
measurement. The options are*:
1.00-100.00 (1 MHz to 100 MHz)
0.02-0.20 (20 KHz to 200 KHz)
0.02-4.00 (20 KHz to 4 MHz)
1.00-50.00 (1 MHz to 50 MHz)
4.00-100.00 (4 MHz to 100 MHz)
30.00-65.00 (30 MHz to 65 MHz)
50.00-100.00 (50 MHz to 100 MHz)
Regardless of the Frequency Range selected, the PSD
measurement will always return 33 evenly spaced
frequency-power points (see Figure 3.24). As was
discussed earlier in Section 1.3.3, low frequencies are useful
for analyzing droop and susceptibility to baseline wander,
high frequencies are useful for assessing slew rate, lower
mid-band frequencies help with peak-peak level, and mid-
band frequencies are indicative of filtering issues.
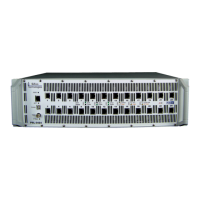
The most natural way to view a PSD measurement is
graphically. By default, the PSD meter will automatically
pop open windows with PSD traces of power versus
frequency for each pair included in the measurement. These
traces are color coded by TIA wire color convention (see Section 1.3.10)
Figure 3.25 shows a PSD trace window for a 1-100 MHz PSD measurement on Pair 1. PSD trace windows can be
inhibited by selecting the Inhibit PSD Traces checkbox.
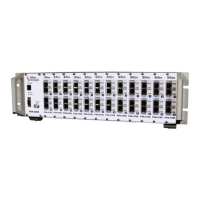
Each PSD trace window includes an Excel push-button control
that will automatically pop open a Microsoft Excel spreadsheet
report** with that PSD trace including all frequency-power data
points (see Figure 3.26).
* It should be noted that much greater flexibility in the
specification of frequency ranges is available from PowerShell
PSA.
** The Microsoft Excel spreadsheet report requires that the host
computer have Microsoft Excel 2007 or newer installed. This
capability is not available on Linux platforms.
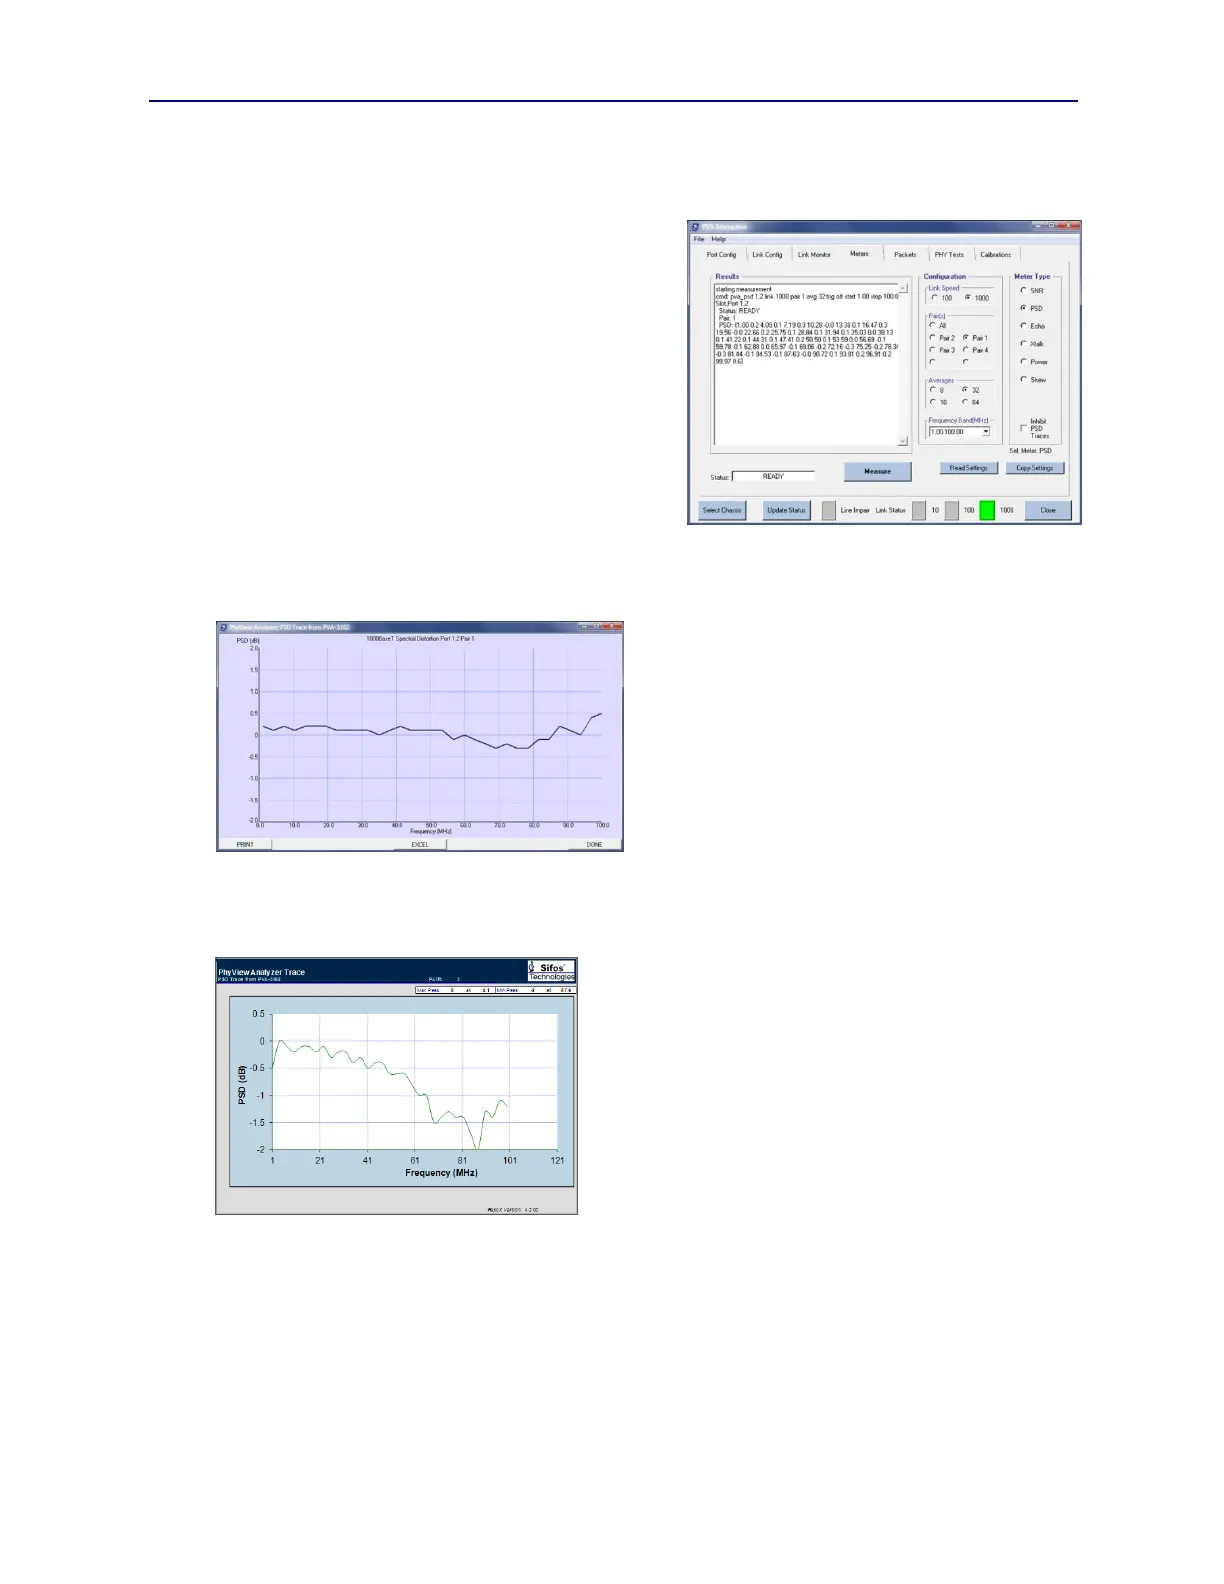
3.10.4. Measurements and Configuration Management
Within the Meters tab menu, all configuration settings are applied and all measurements are performed simply by
pressing the MEASURE button. While a measurement is running, the Status display will show MEASURING. When
the measurement is completed, it will display READY. If there is a problem linking to (or maintaining link with) the
port-under-test, the measurement will terminate with a status of UNLINKED or in some cases, ERROR.
The measurement result will appear in the Results display area. For users who plan to work with PowerShell PSA
scripting, it may be useful to observe the meter command in the display area – this will always precede the
measurement result. Section 4 will cover the topic of PowerShell PSA for the PhyView Analyzer.
Figure 3.24 PSD Measurement
Figure 3.25 PSD Trace on Pair 1
Figure 3.26 PSD Trace in Excel