PVA-3000 Reference Manual
December 2, 2019 Sifos Technologies
Link assessment includes two specific capabilities: Link Monitor and Link Partner assessment.
The Link Monitor reports current link status and link-up parameters such as link rate, duplex, connection mode, and
gigabit mode (1000BaseT only). This can be sampled at any time. The Link Monitor can also be configured to
perform automatic sampling and link status counts over a user-specified period of time. This resource is a key
component to the Receiver Tests topic presented in Section 1.3.12 below.
The Link Partner measurement captures and reports the auto-negotiation and auto-MDI characteristics of a
10/100/1000BaseT port-under-test. This resource is important in qualify which automated tests can be run from the
PhyView PHY Performance Test Suite that is the topic of Section 5.
1.3.2. Transmitter Verification Overview
The PhyView Analyzer will make transmitter measurements while linked using either 100BaseTx or 1000BaseT.
While there are no direct transmitter measurements available for 10BaseT in the PhyView Analyzer, given the
simplicity of a 10BaseT transmission, there are not many possible fault modes that would adversely affect 10BaseT and
not affect 100BaseTx or 1000BaseT. The following PhyView Analyzer measurements assess transmitter performance:
Power Spectral Distortion
Signal-Noise Ratio
Transmission Level
Pair Skew
1.3.3. Power Spectral Distortion
Power Spectral Distortion (PSD) is a measurement of the spectral power characteristics of a 100/1000BaseT
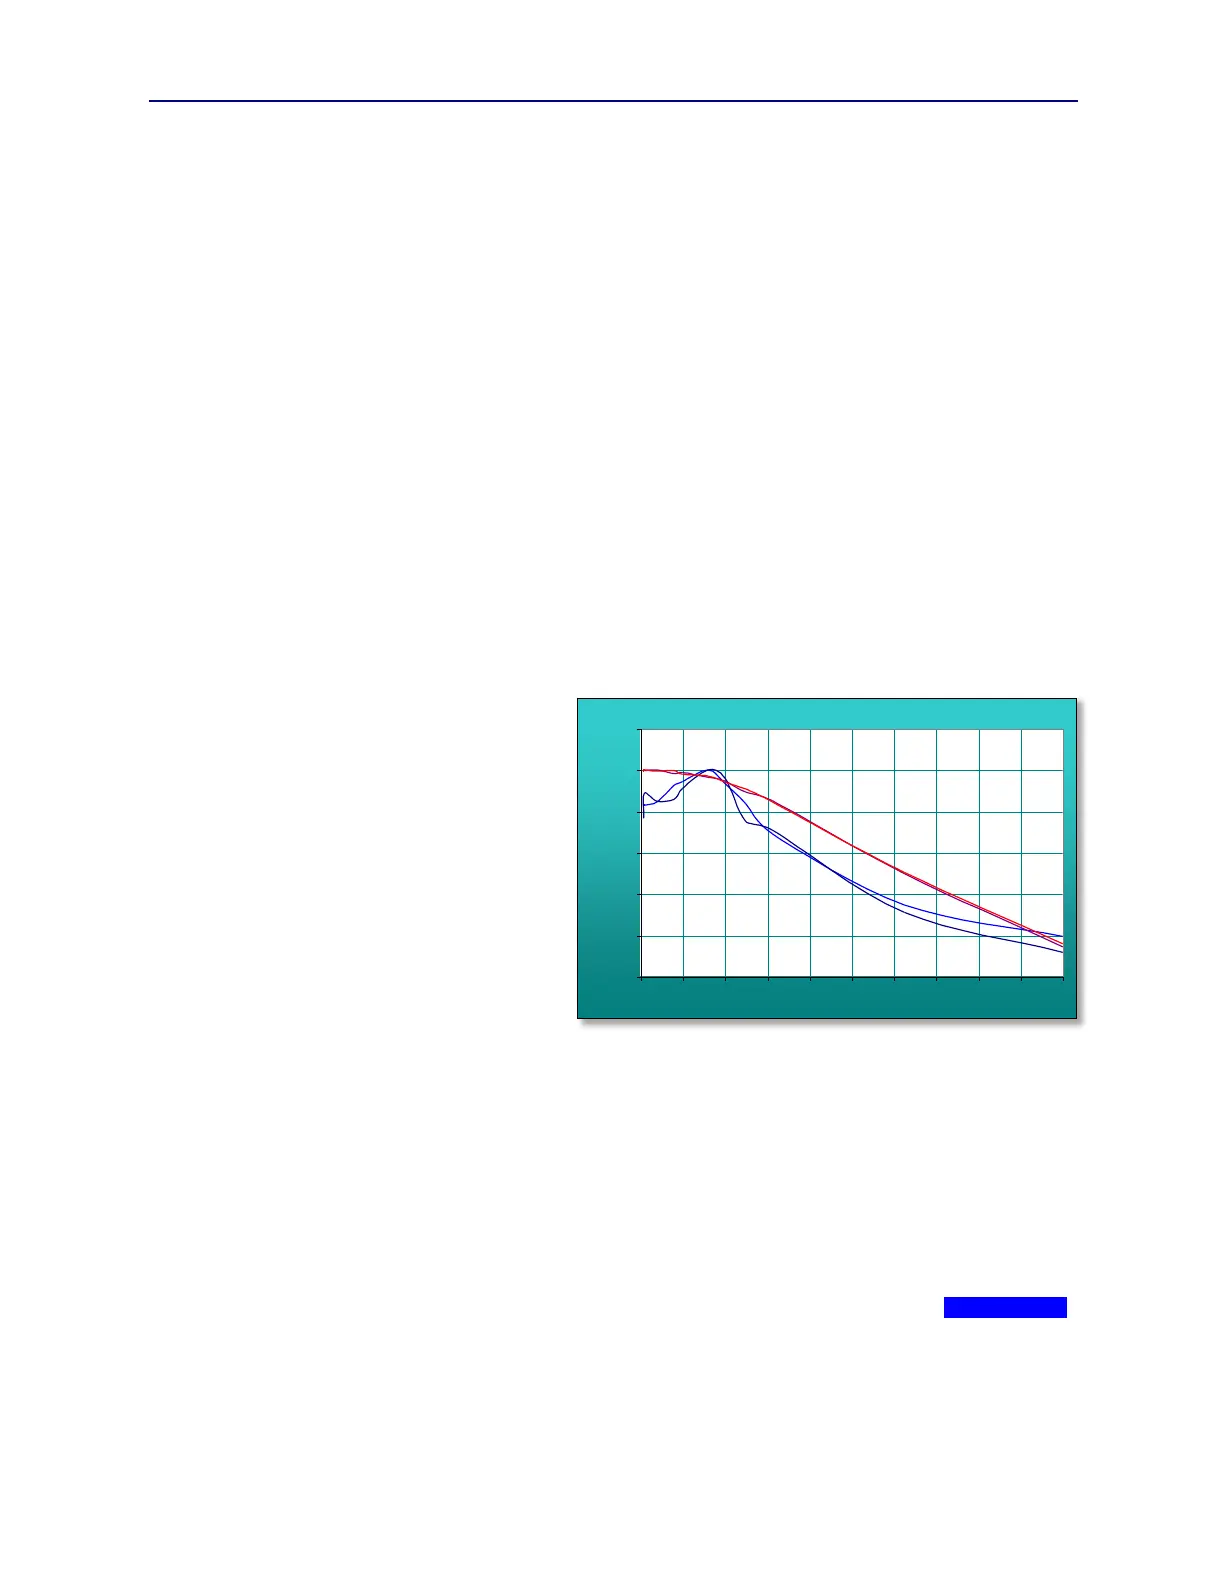
transmitter normalized to a nominal, undistorted 100BaseTx or 1000BaseT transmission spectrum. Figure 1.6
graphically depicts both 100BaseTx and
1000BaseT transmission spectra with and
without packet flow. These spectra have been
adjusted to align peak power levels to 0 dB so
that relative power loss as a function of
frequency is readily visible.
Looking at these spectra, it can readily be
observed that the distribution of power over
frequency is very much tilted to the lower
frequencies. This is critical to how these
technologies overcome the insertion loss of
100M cable channels. Secondly, it is clear
that these spectra are largely not impacted by
packet flow. This is critical to assuring that
IDLE links remain linked with no loss of
receiver synchronization.
The 100BaseTx spectrum shows a distinct
peak in the 16 MHz range, then rolls off to –20 dB by 90 MHz. This characteristic peak relates to a statistical behavior
of the MLT-3 encoding used in 100BaseT. MLT-3 is designed to reduce spectral bandwidth to below 30 MHz.
The PAM5 encoding of 1000BaseT would not naturally produce the band limiting behavior of 100BaseT. So
1000BaseT applies a digital averaging, or low pass filter to roll off the spectrum to roughly match that of 100BaseT.
This protects against high RF emissions and crosstalk that would otherwise result given unshielded twisted pair
transmission media. The pre-distortion filter can then be corrected by the 1000BaseT receiver that knows this exact
filter function. High speed digital signal processing (DSP) is essential in 1000BaseT PHY’s.
The PSD measurement recovers the spectral shape of a transmitted signal, then compares that shape to a nominal, or
idealized spectral shape that depends on the link rate, 100BaseTx or 1000BaseT. This means that the ideal PSD
measurement would be a flat 0dB from low frequency to high frequency. Looking at Figure 1.7, the NOMINAL PSD
trace represents the ideal PSD measurement result.
Many impairments that distort a transmitter signal in the time domain will produce a different type of distortion in the
frequency domain. Figure 1.7 diagrams a number of important distortion types and the expected PSD response to those
impairments. These impairments include:
Figure 1.6 100BaseTx and 1000BaseT Transmission Spectra
Ethernet 100/1000BaseT Spectra
-25.00
-20.00
-15.00
-10.00
-5.00
0.00
5.00
0 10 20 30 40 50 60 70 80 90 100
1000BaseT IDLE
1000BaseT Packet Flow
100BaseTx Packet Flow
100BaseTx IDLE
Ethernet 100/1000BaseT Spectra
-25.00
-20.00
-15.00
-10.00
-5.00
0.00
5.00
0 10 20 30 40 50 60 70 80 90 100
1000BaseT IDLE
1000BaseT Packet Flow
100BaseTx Packet Flow
100BaseTx IDLE