PVA-3000 Reference Manual
December 2, 2019 Sifos Technologies
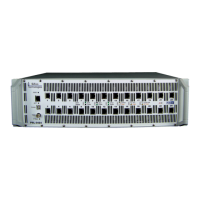
Low (or High) Output Level: A
low output level as shown Figure
1.8a would equate to a LOW
OUTPUT LEVEL trace in a PSD
measurement (see Figure 1.7).
PSD will be below 0 dB,
especially at the lower frequencies
where most of the spectral energy
exists. Similarly, high output
level would correspond to a
higher PSD in the low frequency
bands. Lower frequency PSD
values are approximately related
to voltage using the relationship
20*LOG(Vp-p/Vp-p_nom)
where Vp-p is actual peak-peak
voltage measurement and Vp-
p_nom is the ideal peak-peak
voltage, e.g. 2Vpp for 100BaseTx.
Assuming for the moment that
PSD at 2 MHz is linearly related
to Vp-p, a 2 MHz 1000BaseT PSD that measures –1.4 dB at 2 MHz would equate to 2Vpp * 10
(-1.4 / 20)
= 1.7Vpp.
(Note: The 802.3 standard would expect a minimum of 1.79Vpp for 1000BaseT.)
Low (or High) Slew Rate: Slew rate, or Rise/Fall time, tends to affect 100BaseTx and 1000BaseT signals in the
frequency range above 65 MHz with most of the impact observable above 75 MHz. This means a nominal power
signal with low slew rate (see Figure 1.8c) will approximate 0 dB until the upper frequencies where it will decline.
Both a LOW SLEW rate and a HIGH SLEW rate are depicted in Figure 1.7. Relating the low slew rate to the Ethernet
transmission spectra in Figure 1.6, the higher frequencies would roll off even faster. Low slew rate can be especially
harmful in a 100M link where attenuation of higher frequencies is already a challenge to the link integrity. Conversely,
high slew rate will be detrimental in very short links and will lead to RF emissions
problems.
Excess Droop: Droop in any twisted pair baseband transmission (see Figure 1.8b)
typically comes about because a transformer is removing very low frequencies from the
transmitted signal. Transformers are band limited devices that work over a min-max
frequency range. Because PSD can assess frequency response as low as 20KHz, it is able
to discern EXCESS DROOP (see Figure 1.7) that might typically affect frequencies
below 100KHz. In 100BaseT, droop can be directly compared to baseline wander, that is,
the inability of the transmitted signal to hold a steady voltage for a longer period of time
given an all zero’s encoded data pattern. For example, 100KHz would correspond to
10sec, 1,250 symbol periods, or a data pattern of 125 bytes. Power-over-Ethernet can
worsen droop if the delivery of DC current is not evenly split across both conductors of a
twisted pair. This impairment, referred to as DC Unbalance, causes saturation in the
transformer which in turns clips off low frequency response.
Over Filtering: Most 10/100/1000BaseT interfaces use transformer magnetics not only
for isolation but also for EMI and common mode suppression. This requires a low-pass
filtering effect that should nominally roll off above 100MHz. If this filtering cuts off at
lower frequencies like 30 – 50 MHz, then PSD will naturally pick this effect up as a
spectral distortion. This is shown in Figure 1.7 as OVER EMI FILTERED.
The PHY Performance Test Suite (see Section 5) takes advantage of relationships
between PSD measurements and certain time-domain measurements in order to predict
parameters such as Vpp (100/1000BaseT), Rise/Fall Time (100BaseT), and Template
Fit (1000BaseT). Those relationships start with theoretical underpinnings including the
topics of these paragraphs, and then add in a body of empirical correlation experience in
order to tighten the predictive accuracy of those critical 802.3 conformance parameters.
PSD is a calibrated measurement so that effects of cabling, connectors, and even test receivers are properly
compensated. Fully automated calibrations requiring no external calibration standards simplify the task of periodic
calibration. PSD can be readily used to measure insertion loss across link components including cabling, connectors,
and patch panels. PSD is also useful for assessing signal integrity at any service point outlet.
Figure 1.8 Impairments in
the Time Domain
Droop
Fast Slew
Slow Slew
Level (Vpp)
(a)
(b)
(c)
(d)
Droop
Fast Slew
Slow Slew
Level (Vpp)
Droop
Fast Slew
Slow Slew
Level (Vpp)
(a)
(b)
(c)
(d)
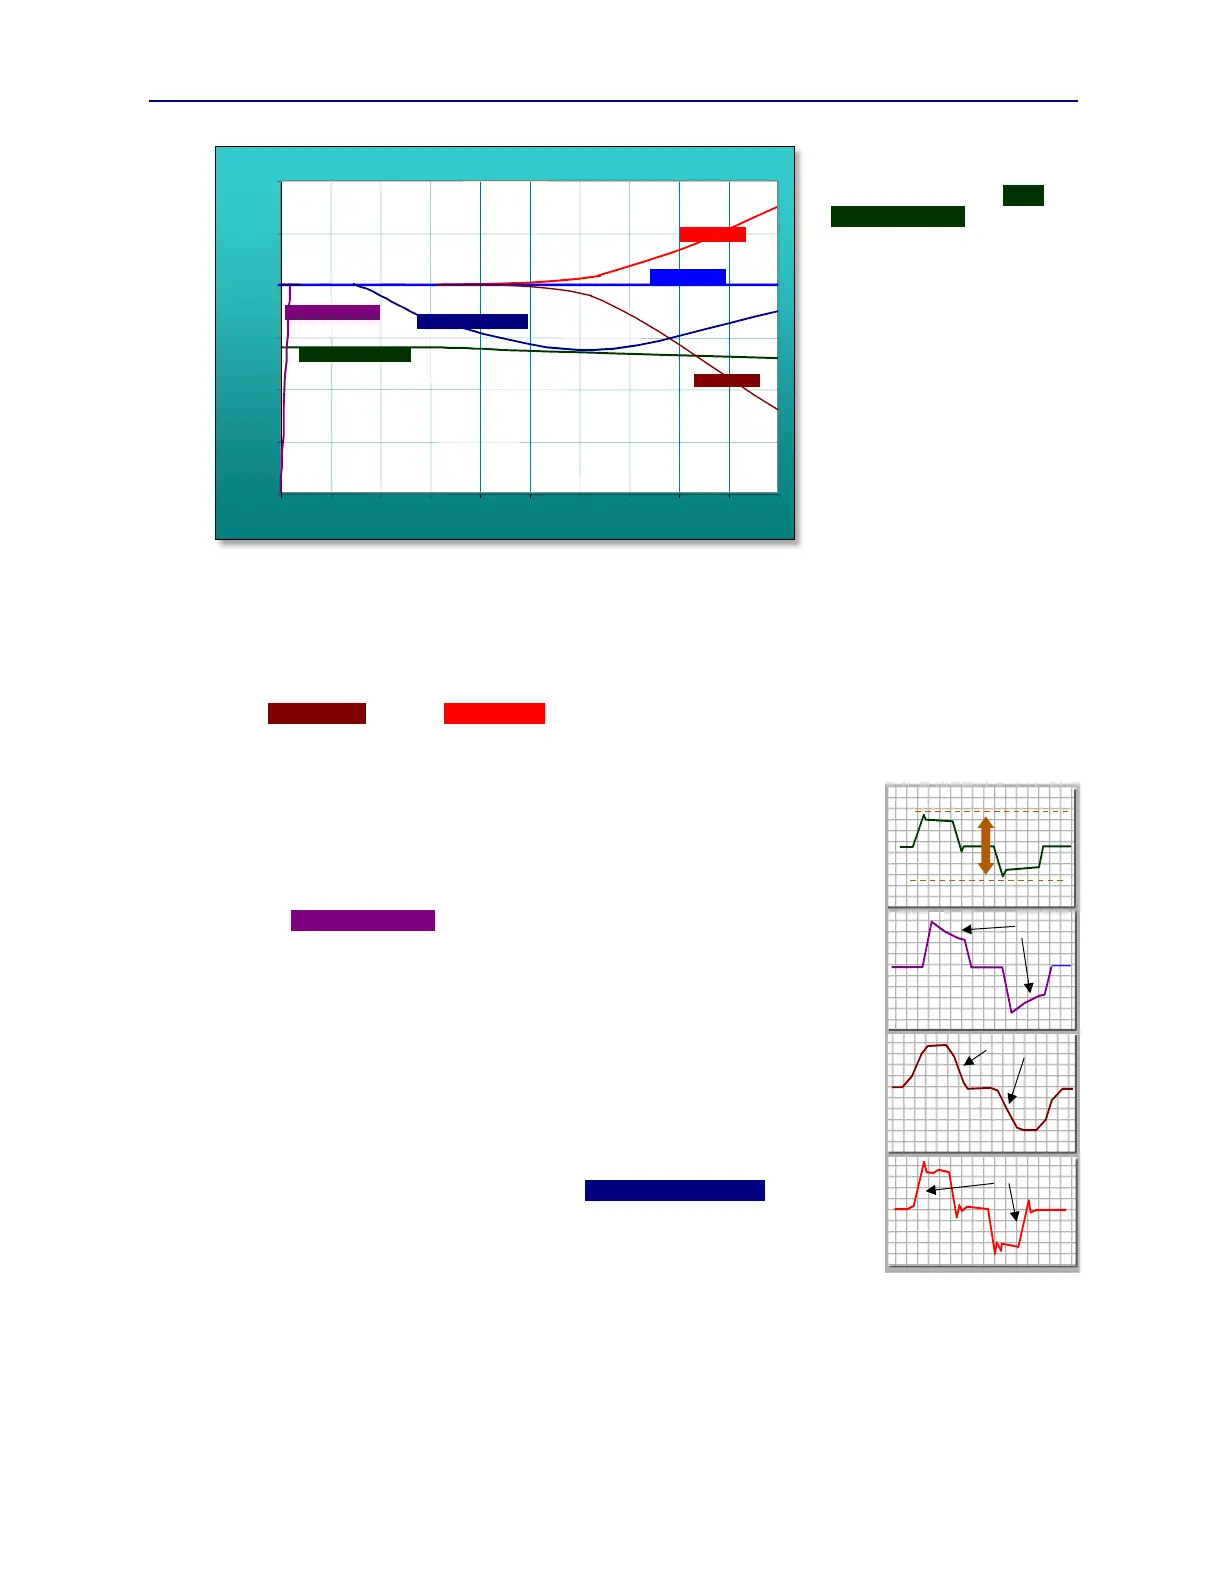
Figure 1.7 PSD Responses to Various Impairments
Power Spectral Density Impairment Responses
-4.00
-3.00
-2.00
-1.00
0.00
1.00
2.00
0 10 20 30 40 50 60 70 80 90 100
Frequency MHz
dBc
LOW OUTPUT LEVEL
OVER EMI FILTERED
EXCESS DROOP
LOW SLEW
NOMINAL PSD
HIGH SLEW
Power Spectral Density Impairment Responses
-4.00
-3.00
-2.00
-1.00
0.00
1.00
2.00
0 10 20 30 40 50 60 70 80 90 100
Frequency MHz
dBc
LOW OUTPUT LEVEL
OVER EMI FILTERED
EXCESS DROOP
LOW SLEW
NOMINAL PSD
HIGH SLEW