StructureMap
The StructureMap feature overlays SideScan images from a
StructureScan source on the map. This makes it easier to visualize
the underwater environment in relation to your position, and aids in
interpreting SideScan images.
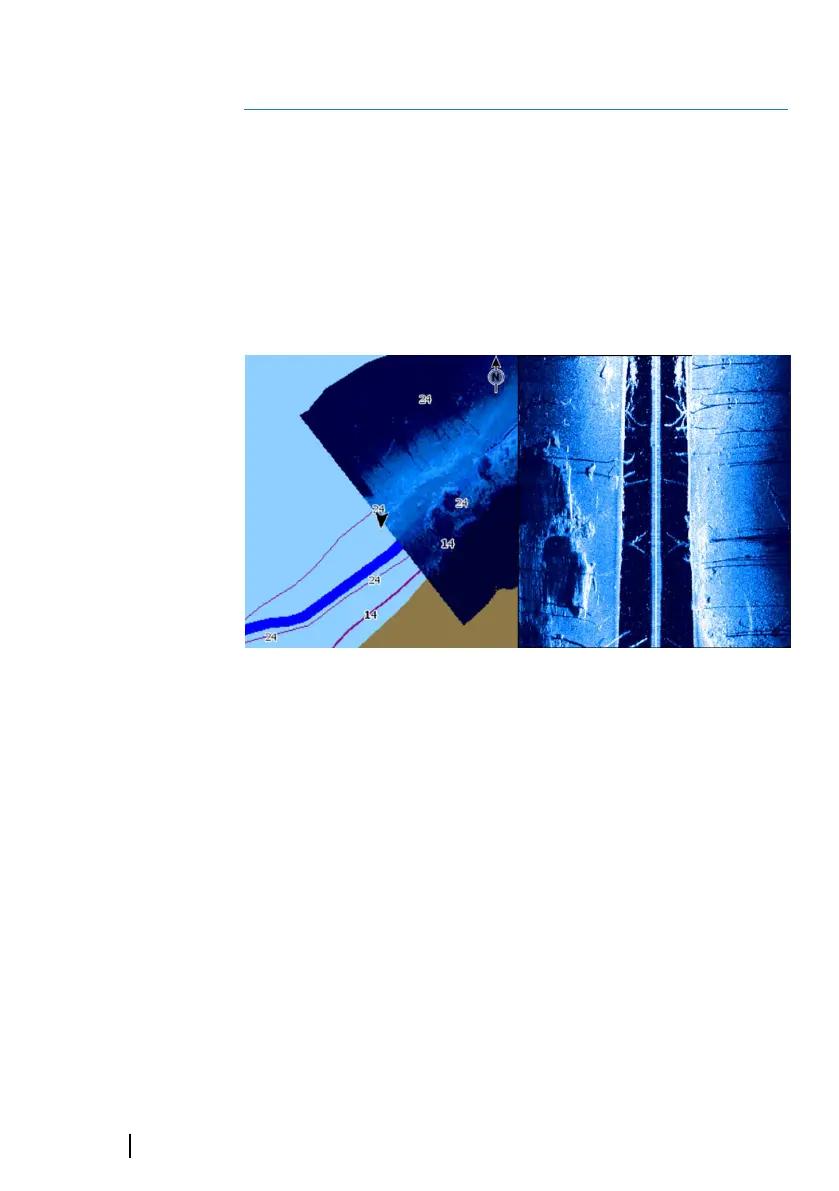
The StructureMap image
The example below shows a chart panel with Structure overlay,
combined with a traditional SideScan panel.
You move around in the chart as usual when you have a Structure
overlay:
• Zoom the chart and the scanned image by using the zoom (+ or
-) buttons. Drag on the panel to view the scanned image.
Activating Structure overlay
1. Turn on Structure overlay from the chart menu
-
The chart menu is increased to show Structure options
- Structure data starts to appear on the chart screen as soon as
Structure overlay is enabled
2. Select Structure source
- Live data is default
Ú
Note: Structure overlay can also be activated by selecting a
saved StructureMap file in the files browser.
12
132
StructureMap | GO XSE Operator Manual