SVAN 971 User Manual – Appendixes
D.5 STATISTICAL LEVELS – LNN DEFINITION
The noise level L(t) is the continuous random variable. The
probability that the temporary noise level L(t) belongs to the
interval
is called the class density and it can be
expressed by the equation:
PtLLtLLP
n
1i
ikkk
- time intervals, in which the noise level
- so-called class interval or distribution
class of the series,
- total observation period.
In case when the class interval approaches infinity, the probability of L(t) tends to the probability of
value is strictly determined, and it depends mainly on the dynamics of the measurements performed in the
instrument. There are 120 classes in the instrument and the width of each class is equal to 1 dB. The histogram
is the set of the class density values calculated for all classes.
The statistical distribution function, which determines the
probability (expressed in %) of the noise occurrence on the level
equal or less than
is given by the formulae:
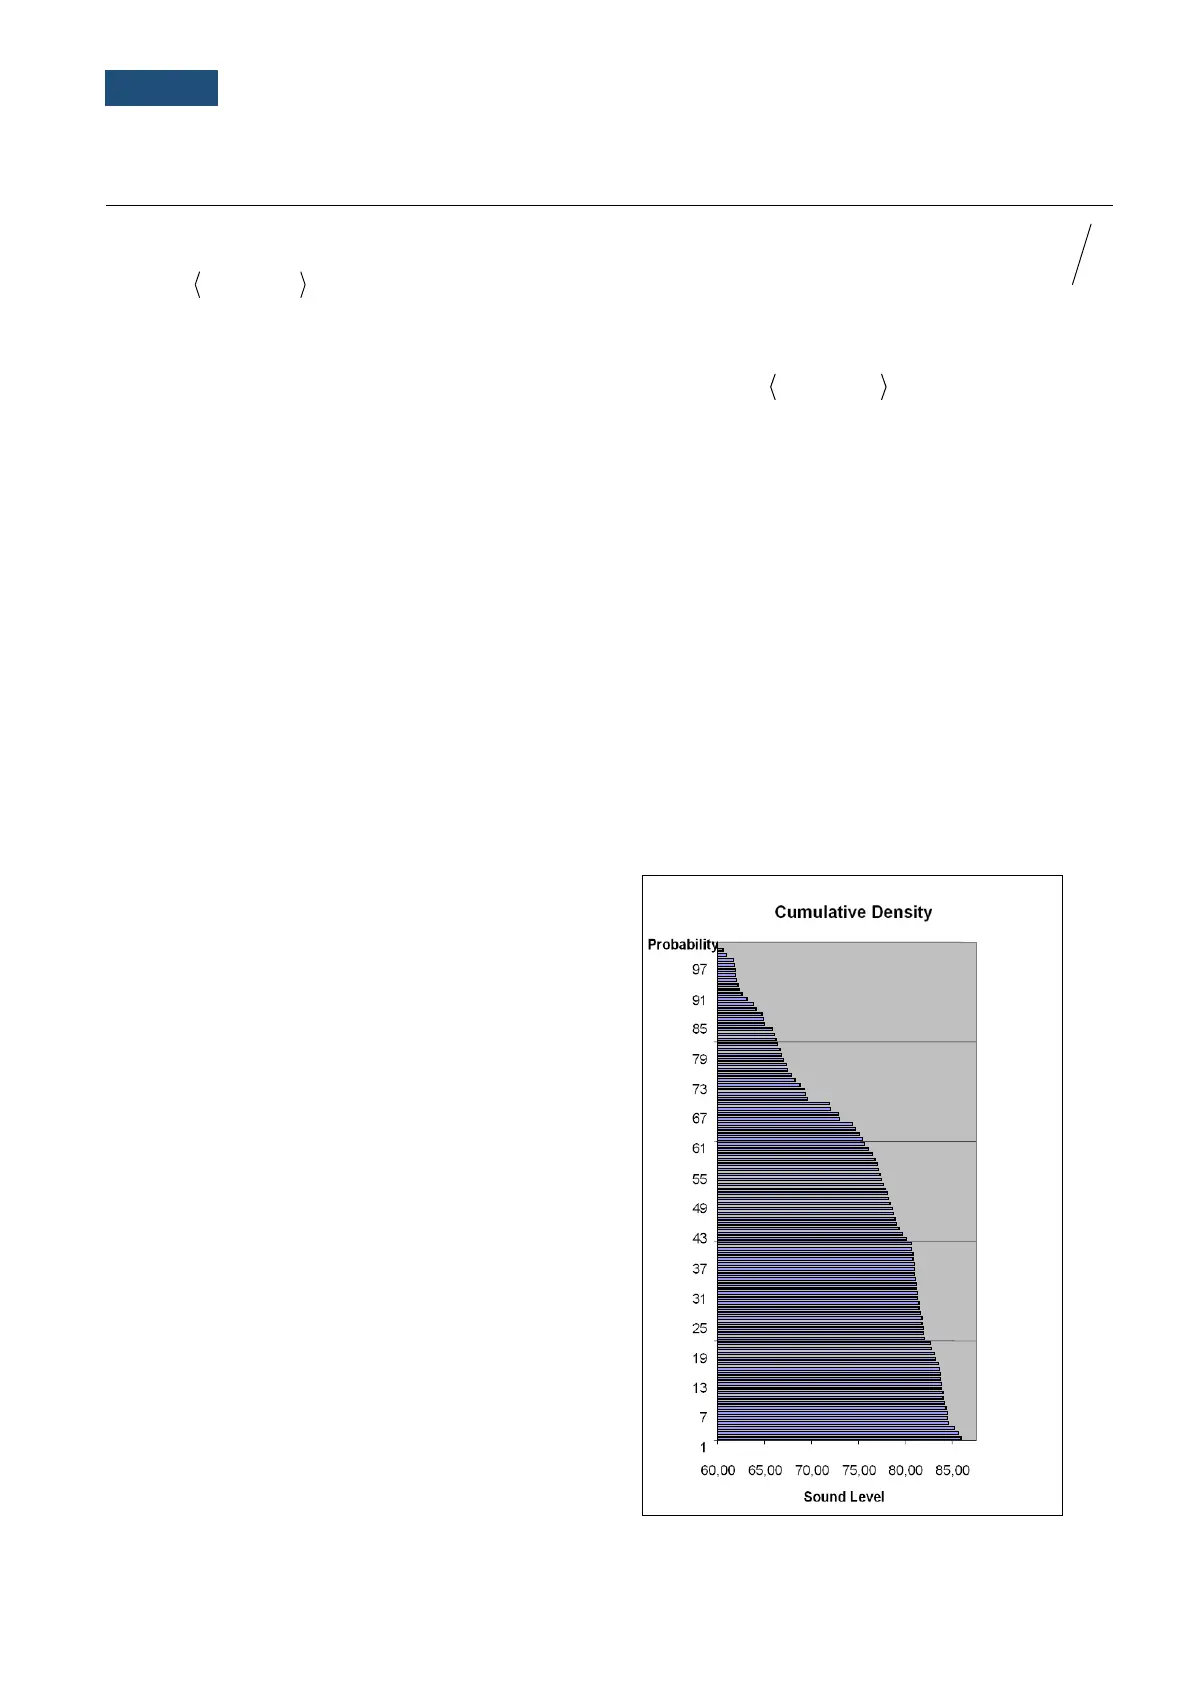
The cumulative density function, expressed by the equation:
is directly used to determine so-called statistical levels Lnn or
position parameters of the distribution.
jj
LtLP1LtLP
The Lnn is the certain boundary level surpassed by the temporary noise level values in not more than nn of the
observation period.
Example:
Let us assume that L35 is equal to 76.8 dB. It means
that during the measurements the noise level 76.8 dB
was exceeded in not more than 35% of the
observation period.
The cumulative density function for the exemplary
data is presented in Figure on the right side. In order
to determine the Lnn level one has to draw the
horizontal cursor and find out the crossing point
between the cumulative density function and the
cursor. In the instrument the user can determine 10
statistical levels - from L01 to L99 (1% step
of observation period).
The display in the instrument presents only first
statistical level N1 (set to: L01 up to L99).
The statistical level Lnn value, the profile’s number the
statistics are taken from, the RMS detector (Lin., or
Exp.: Fast, Slow or Imp.), the filter’s name (A, C or Z)
and real time are displayed in the top-right side of the
display in one-result view mode.
Exemplary cumulative density