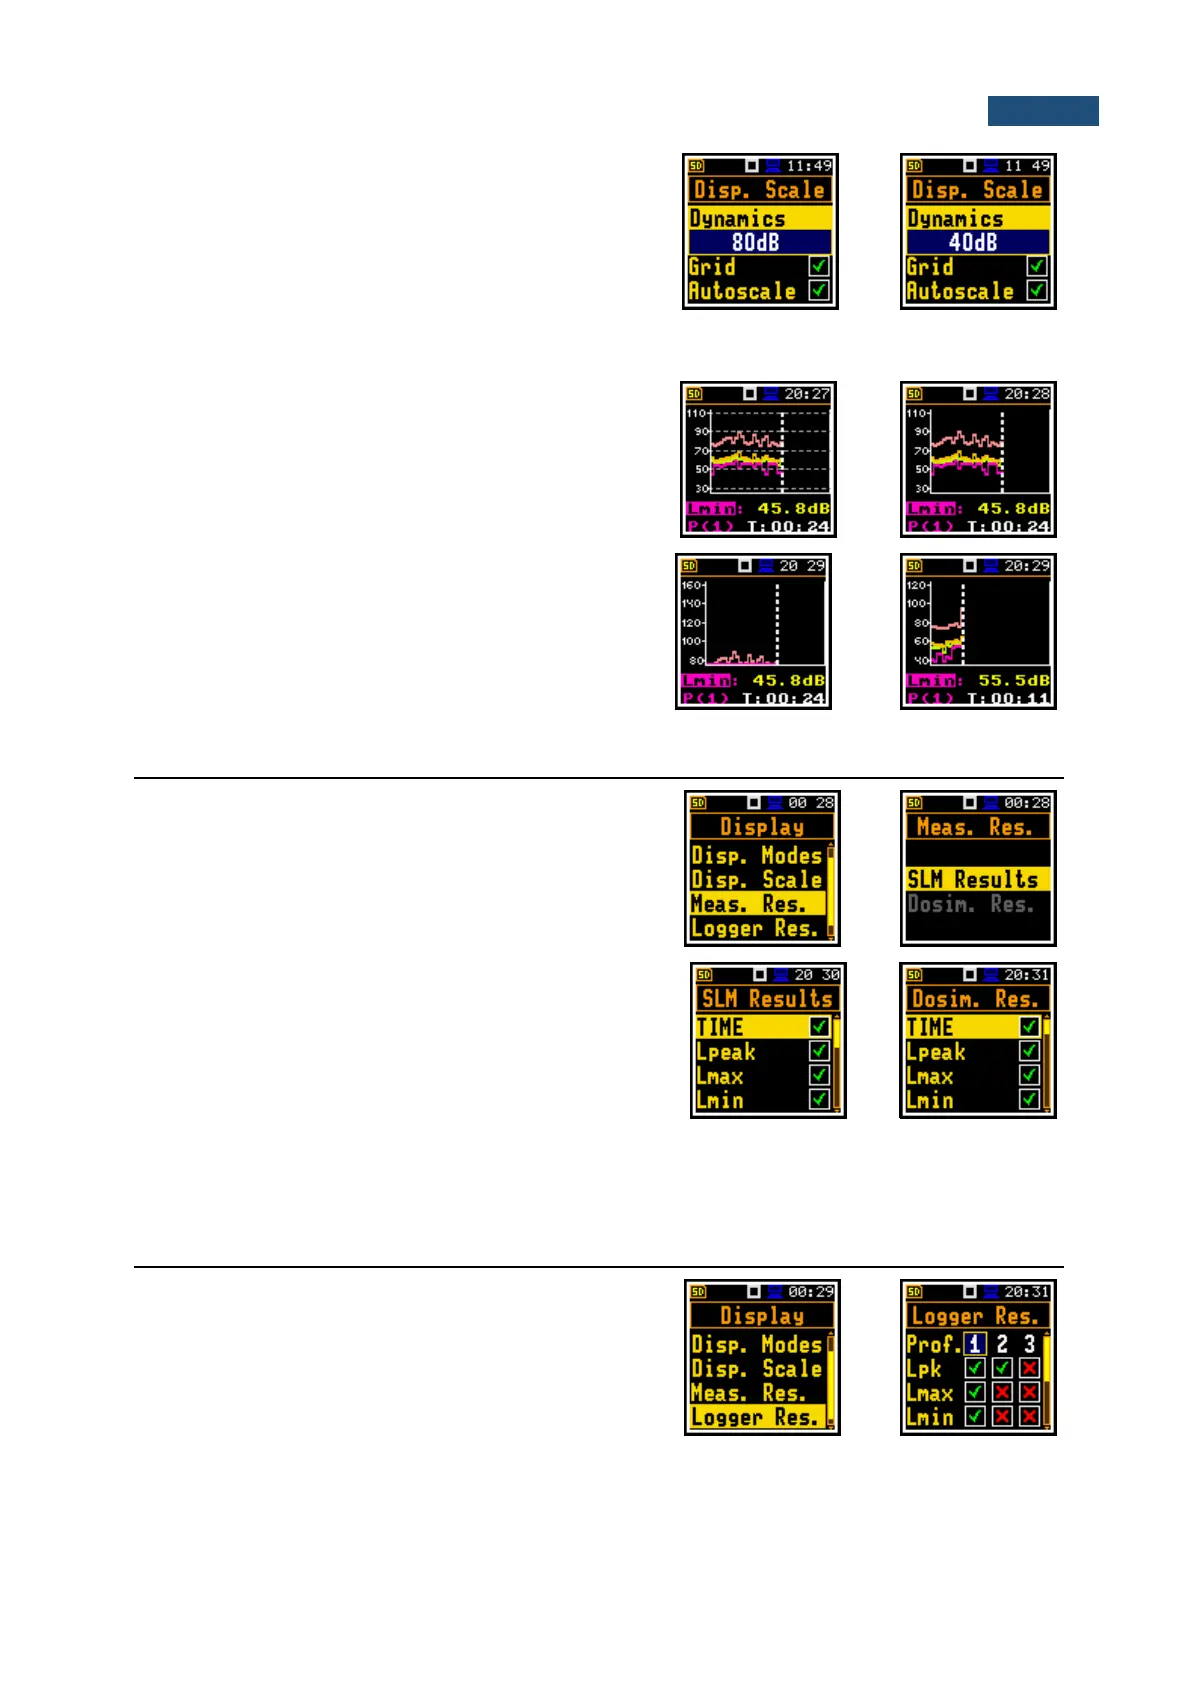
Scaling the vertical axis of the plot
The Dynamics position enables selecting the required
dynamic range of the plot (Y-axis). It is possible to select
the range from the set: 10dB, 20dB, 40dB, 80dB and
120dB.
Switching the grid on/off
The Grid position enables switching on or off the
horizontal grid lines of the plot.
Switching the automatic Y-scale adjustment on/off
The Autoscale position switches on the automatic scale
adjustment of the Y-axis. The adjustment is performed
automatically right after the start of the measurement to
suit the initial level of the input signal from the
microphone.
6.3 SELECTION OF SUMMARY RESULTS FOR PRESENTATION – MEASUREMENT RESULTS
The Meas. Res. position enables choosing the Sound
Level Meter (SLM Results) or Dose Meter
(Dosim. Res.) measurement results, which will be
presented in the different display modes.
The result can be selected from:
- SLM Results list: TIME, Lpeak, Lmax, Lmin, L,
Leq, LE, Lden, LEPd, Ltm3, Ltm5, Ln, and OVL;
or
- Dosim, Res. list: TIME, Lpeak, Lmax, Lmin, L,
DOSE, D_8h, PrDOSE, LAV, Leq, LE, SEL8, E,
E_8h, LEPd, PSEL, Ltm3, Ltm5, Ln, PTC, PTP,
ULT, TWA, PrTWA, Lc-a and OVL; with the
◄ / ► key.
6.4 CHOOSING LOGGER RESULTS FOR PRESENTATION - LOGGER RESULTS
The Logger Res. position enables choosing the Logger
Results (time-history results), saved in the logger file,
which will be displayed in the Logger display mode. The
results are selected with the ◄ / ► key pressed together
with <Shift>.